

1. Introduction
2. Methodology
2.1 Concept of pseudo-Conjugate Heat Transfer Analysis
2.2 Methodology for pseudo-Conjugate Heat Transfer Analysis
2.3 Methodology for Turbulent-Combustion Numerical Simulation
2.4 Model Scramjet Combustor and Computational Domain
3. Numerical Result
3.1 Overall Combustion Characteristics
3.2 Results of the pseudo-Conjugate Heat Transfer Analysis with Combustion Test
4. Conclusion
1. Introduction
High-speed air-breathing propulsion systems, represented by scramjet engines, are the most practical form of future hypersonic propulsion. Through numerous ground experimental tests [1,2,3,4,5,6,7,8,9,10,11,12], theoretical analyses [13], and numerical studies [14,15,16,17,18,19,20,21] conducted, the underlying physics of supersonic combustion has been considerably elucidated, leading to a significant level of technology accumulation.
When hydrocarbon fuels are used, fuel preheating becomes essential for ignition, flame holding, and stabilization. Fuel preheating is achieved through heat exchangers incorporating fuel micro-cooling channels within the engine jacket. Consequently, heat exchanger design is considered a critical factor for stable operation and optimal propulsion performance at the target flight Mach number [22]. To facilitate sufficient endothermic reactions of the fuel within cooling channels and ensure structural stability, it is necessary to conduct a thermal environment analysis of the combustor jacket.
To predict thermal environments numerically, conjugated heat transfer (CHT) analysis, which couples heat transfer between fluid and structure, is required. CHT analysis has been applied to problems such as thermal environment analysis of hypersonic vehicles [23,24], fuel cooling capacity in microchannels, and investigation of the inlet wall temperature under various operating conditions [25,26,27]. However, owing to the extremely short time scales of chemical reactions, CHT analysis with the combustion simulation is often limited to short sampling times (O(10-3 second)) or primarily focuses on wall cooling effects on the reacting flow fields [28]. Therefore, a different approach is required to extend the sampling time of CHT analysis considering reacting flow for flight or ground test time on order of tens of seconds.
The present combustor is a kerosene-fueled tandem cavity scramjet combustor equipped with a heat exchanger. The heat exchanger aims to pre-heat the fuel and cools the engine jacket simultaneously. Designing heat exchanger requires embedding several hundred micro-channels in the structural domain of the combustor jacket and then performing a CHT analysis. However, because the relevant ground-test duration spans several tens of seconds, such a fully coupled CHT simulation is computationally prohibitive. To simulate a ground combustion test time lasting tens of seconds, a p-CHT (pseudo-Conjugate Heat Transfer) analysis approach was established. This approach pre-solves the reacting flow field through combustion simulation and employs the results as boundary conditions for CHT analysis. Utilizing p-CHT, the thermal environment of the scramjet structure on the order of tens of seconds could be investigated while significantly reducing computational cost. The temperature distribution extracted from the p-CHT analysis enhances our understanding of the thermal environment that prevails during ground combustion tests. In addition, boundary-condition data required for both three-dimensional and quasi-one-dimensional simulations of heat-exchanger design were obtained from the present p-CHT simulation.
2. Methodology
2.1 Concept of pseudo-Conjugate Heat Transfer Analysis
The primary objective of this study is to investigate the impact of the reactive flow field on the thermal environment of the combustor structure under the ground test conditions, and with the aim of designing and quantifying more effective heat exchangers. Data on the thermal environment of the structure can be used as initial input for quasi one-dimensional theoretical analysis or three-dimensional numerical simulation to evaluate the fuel preheating capacity in the microchannels of the heat exchanger. Therefore, CHT analysis with considering the ground combustion test environment is essential. Owing to the significant disparity between the chemical reactions time scale and transient structural heat transfer time scale (), it is common practice in CHT analysis to employ wall boundary temperature data derived from combustion simulations, typically conducted over hundreds to thousands of iterations, as boundary conditions for heat conduction analysis [29,30]. Given this time scale disparity, this approach is considered acceptable. However, turbulent-combustion numerical simulation faces inherent limitations in achieving sampling times on the order of seconds. The present study targets a direct-connect Turbine-based Combined Cycle (TBCC) combustor with combustion test times on the order of tens of seconds, transient CHT analysis using practical methods becomes unfeasible.
To overcome this hurdle, we propose a one-way CHT analysis approach. This one-way conjugated heat transfer approach, which we term ‘pseudo-Conjugate Heat Transfer (p-CHT) analysis, is predicated on the following limitation. The p-CHT approach does not account for the cooling effect of the combustor structure on the burnt gases. The magnitude of the cooling effect of the structure on the burnt gas can be assessed by comparing the temperature distributions predicted in combustion simulations that impose adiabatic-wall (AD) and CHT boundary conditions. Kim et al. [24] carried out simulation for a scramjet engine operating under typical flight conditions, applying both AD and CHT wall condition to the combustor internal walls. Their results revealed an average near wall-gas temperature difference of roughly 80 K between the two cases (AD, CHT). This offset is judged as an acceptable trade-off in view of the computational efficiency afforded by the p-CHT approach. Because of this limitation, the thermal environment of the structure predicted by p-CHT analysis likely represents an extreme case we can imagine. Nonetheless, we assume that the p-CHT approach currently represents the sole feasible methodology for investigating the structural thermal environment induced by reactive flow fields in the order of tens of seconds.
2.2 Methodology for pseudo-Conjugate Heat Transfer Analysis
The p-CHT solver is based on a CHT solver developed by Kim et al.[24] They validated their CHT solver against a cylinder leading-edge model test conducted at NASA Langley, achieving results consistent with experimental data [31] and previous numerical studies [29,30]. The p-CHT solver, in contrast, resolves the combustion field a priori and employs its solution as a boundary condition. Consequently, the governing equation for the p-CHT solver is a simplified form of the heat conduction equation, wherein equations for chemical species, momentum, energy, and turbulence transport are omitted. Within the energy equation, terms for diffusion, viscous dissipation, and source are also removed, resulting in the governing equation for the p-CHT taking the following form (Eq. (1)).
It is important to note that although the governing equation is treated as a single equation, complete information of the chemical species involved in the flow must be known. This is because determining the thermal conductivity of the burnt mixture and ambient air is essential to perform convective and conductive heat transfer calculations at the fluid-structure interface. The heat flux at the fluid-structure interface for convective and conductive heat transfer is evaluated using the Biot number ()(Eq. (2)).
At the structure-structure interface, the heat flux is treated to ensure a constant heat flux is transferred across the interface, thus ensuring continuity of heat flux across the boundary. In a conventional CHT analysis in which the computational grids of the fluid and solid domains overlaps at the interface, the heat flux exchange at the fluid-structure interface is accomplished through the balance equation presented below Eq. (3).
Where is conductivity of the fluid, is thermal conductivity of solid. And , is first grid height of the fluid-side grid and solid-side grid at the fluid-solid interface, respectively. In general, the temperature in Eq. (3) is taken to be the temperature at the first grid adjacent to the solid wall, as obtained from the flow- or combustion simulation domain. However, in the p-CHT solver, the term in Eq. (3) is substituted with the wall temperature predicted in a prior standalone flow- or combustion simulation. Therefore, while the heat flux to the structure is calculated using Eq. (3), the heat flux to the fluid is not updated and is neglected.
2.3 Methodology for Turbulent-Combustion Numerical Simulation
The p-CHT solver requires a priori solution for the reactive flow field. The target of this study is a Turbine-Based Combined Cycle (TBCC) combustor wherein compressible reactive flow and turbulent mixing are dominant throughout the system. An in-house, density-based turbulent-combustion solver was utilized [32,33] to get a priori solution for the reactive flow field on the TBCC combustor. This solver has been employed in various combustion applications, such as ram accelerators and shock-induced combustion [34,35,36], scramjet combustors [14,20,35,36], supersonic turbulent jets [37], and rocket-type detonation engines [38].
The governing equations comprise transport equations for each chemical species, momentum, energy, turbulence kinetic energy, and dissipation rate. In this study, surrogate kerosene (KERO) is considered as the fuel. With the inclusion of nitrogen, treated as an inert gas, transport equations are formulated for a total of six chemical species, yielding twelve governing equations in total. While laminar chemical reaction mechanisms encompassing hundreds or thousands of species are required for high-fidelity simulation of kerosene-fueled problems [39], practical limitations arise due to computational cost. Therefore, in the present study, the global reaction mechanism of Franzelli et al. [40], comprising two reaction steps and five chemical species (KERO, O2, CO, CO2, H2O), was utilized. Franzelli et al. proposed the following two-step global reaction mechanism for kerosene surrogate C9.7396H20.0542.(KERO)
This laminar chemical reaction mechanism governs flame speed and auto-ignition time via the R1 reaction and regulates flame temperature via the CO-CO2 equilibrium in the R2 reaction. Eq. (4) and (5) contain a correction term, and those accounts for flame-speed adjustment in the fuel-rich combustion regime. Because this term is uniformly assigned a value of 1.0 at a local equivalence ratio of approximately under 1.1, it was treated as unity in the present study. While global and skeletal kerosene reaction mechanisms [41] are under development for application at realistic computational costs, the reaction mechanism proposed by Franzelli et al. [40] was employed in this study because it provides acceptably accurate results at a significantly reduced computational cost. The heat of formation for the surrogate KERO was obtained from Burcat’s transport tables [42], and polynomial coefficients for specific heat determination, along with coefficients for each reaction step, are detailed in the referenced publications [40]. Given that a high-fidelity combustion model suitable for high Mach numbers remains under development [43], a “quasi-laminar approach” was adopted without a separate combustion model.
The turbulence was treated with IDDES (Improved Delayed Detached Eddy Simulation) [44], with convective terms spatially discretized using a third-order accurate TVD-MUSCL (Total Variation Diminishing - Monotonic Upstream- centered Scheme for Conservation Laws) scheme, and viscous terms treated with a second-order central difference scheme. Time integration was performed using a second-order accurate, fully implicit LU-SGS (Lower-Upper Symmetric Gauss-Seidel) scheme, with a maximum of three sub-iterations imposed as needed. The temperature derived from the finite-rate chemistry calculation was treated to ensure that an error of less than 1% occurred in each Newton-Raphson iteration, based on dimensionless values. Turbulent Prandtl and Schmidt numbers were set to 0.7.
2.4 Model Scramjet Combustor and Computational Domain
The combustor model of the present study is a scramjet combustor with a tandem cavity flame holder, which is a component of a TBCC (Turbine-Based Combined Cycle) engine. As depicted in Fig. 1, heat exchangers for kerosene fuel preheating are installed into the upper and lower walls of the combustor. These heat exchangers were designed following the methodology outlined by Yang et al. [22]. Liquid kerosene, injected under high pressure, undergoes preheating within these heat exchangers via an endothermic reaction prior to injection into the combustor. The combustor has a total length of 1,025 mm, while the isolator section features a cross-section measuring 100 mm in width and 20 mm in height. Through previous theoretical [22], experimental and numerical studies [1,2,3,4,5,6,7], EAH (Electrically Air Heater) and VAH (Vitiated Air Heater) facilities have been established to ensure high-enthalpy air supply under various operating conditions. In this study, by simultaneously operating the EAH and VAH, high-enthalpy air at Mach 2.0, 1.004 bar (static pressure), and 755 K (static temperature) was supplied to the isolator inlet. The total mass flow rate of the incoming air is approximately 1.0 kg/s.
The fuel injector is located 244.5 mm downstream of the isolator inlet, and four hole-type injectors, each with a diameter of 1.0 mm, are arranged across the width. The data used in this study correspond to a global equivalence ratio of 0.24 with a total fuel mass flow rate is 16 g/s. The pre-heated kerosene fuel has a static temperature of 747.25 K. The overall experimental test time is approximately 34 seconds. Detailed operating conditions are noted in Table 1.
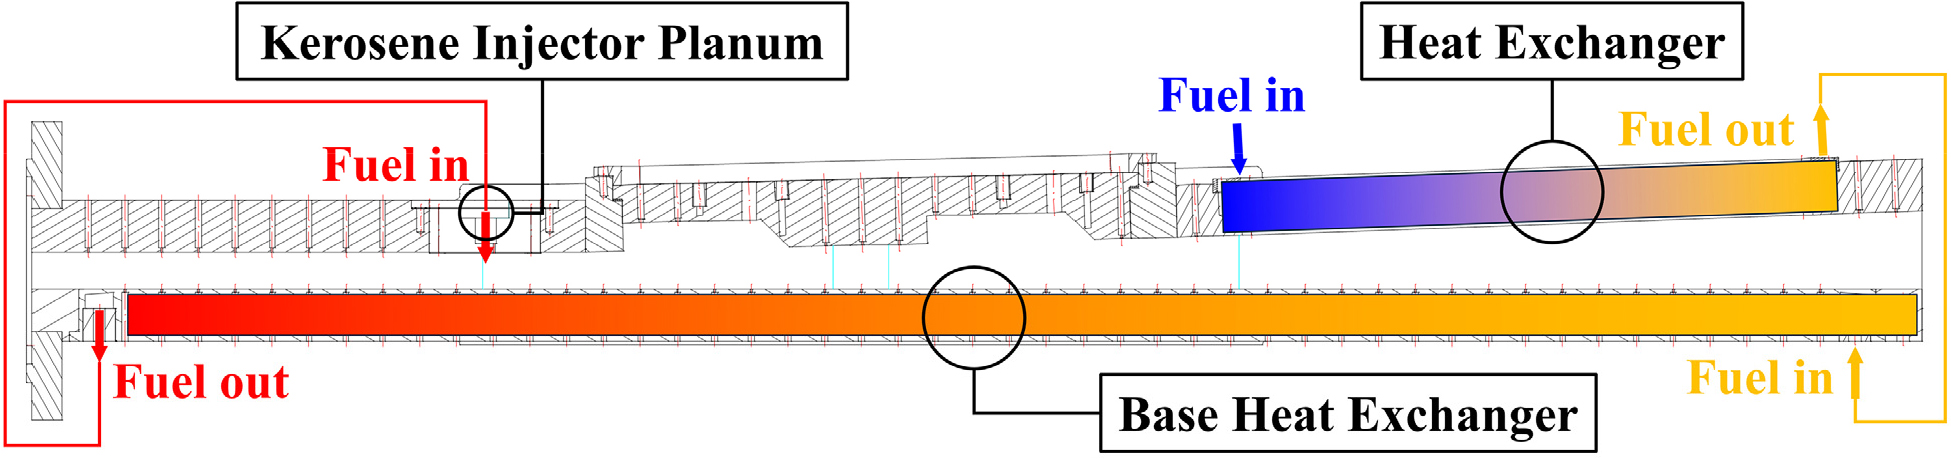
Table 1.
Operating and fuel injection conditions in the combustion simulation.
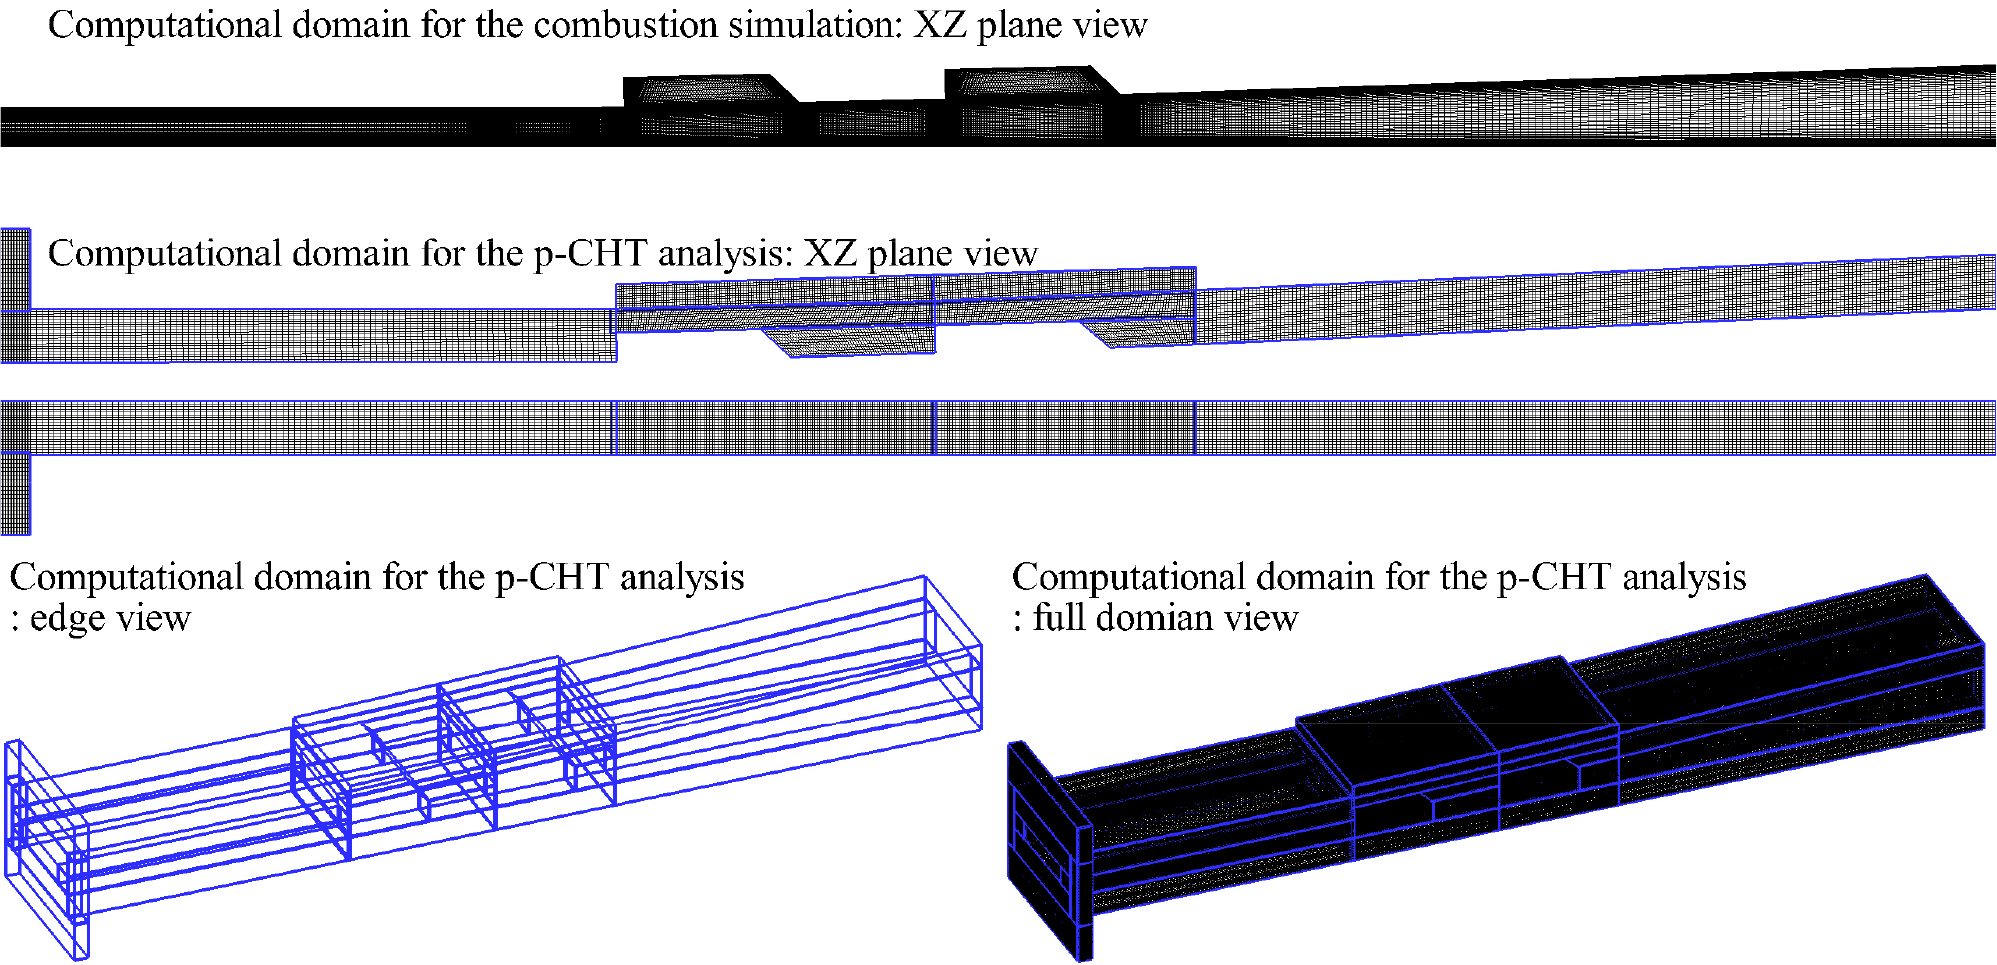
Approximately 15 million structured grids were constructed for the turbulence-combustion simulation. The computational domain was set from the isolator inlet to the combustor exit as depicted in the top of Fig. 2. All grids were designed to maintain a growth ratio not exceeding 20%. Near-wall grids were refined to achieve a y+ value ranging from 0.8 to 1.0, with 10 grid points adjacent to each wall exhibiting a growth ratio of 10%. The entire computational domain was partitioned into 192 blocks for MPI parallel computation, with each block processed by an Intel Xeon 6226R 2.70 GHz CPU. Non-catalytic, no-slip, and adiabatic wall conditions were applied to all wall boundaries.
The computational domain for the p-CHT analysis is depicted in the bottom of Fig. 2. The computational domain encompasses the entirety of the combustor structural region, extending from the flange at the isolator inlet. For simplification, however, components such as bolts, optical windows (quartz), and welds parts were idealized. Total number of grid for p-CHT analysis is approximately 1.7 M. The structure is constructed from STS316L with a mass density of 7.98 g/cm³, a specific heat capacity of 0.5 J/g・K. The thermal conductivity, which dominantly affects the heat flux, was evaluated as an empirical formula functioned by temperature according to Eq. (6)[45].
The initial structural temperature of the structure was set to 755 K, consistent with the temperature of the incoming air. For the external surfaces of the structure exposed to ambient air, ambient air conditions at 300 K were applied. For the internal flow path regions, the p-CHT analysis was conducted by mapping temperature distributions obtained from the combustion simulation. In the present study, a total combustion test duration of 60 seconds was assumed.
3. Numerical Result
3.1 Overall Combustion Characteristics
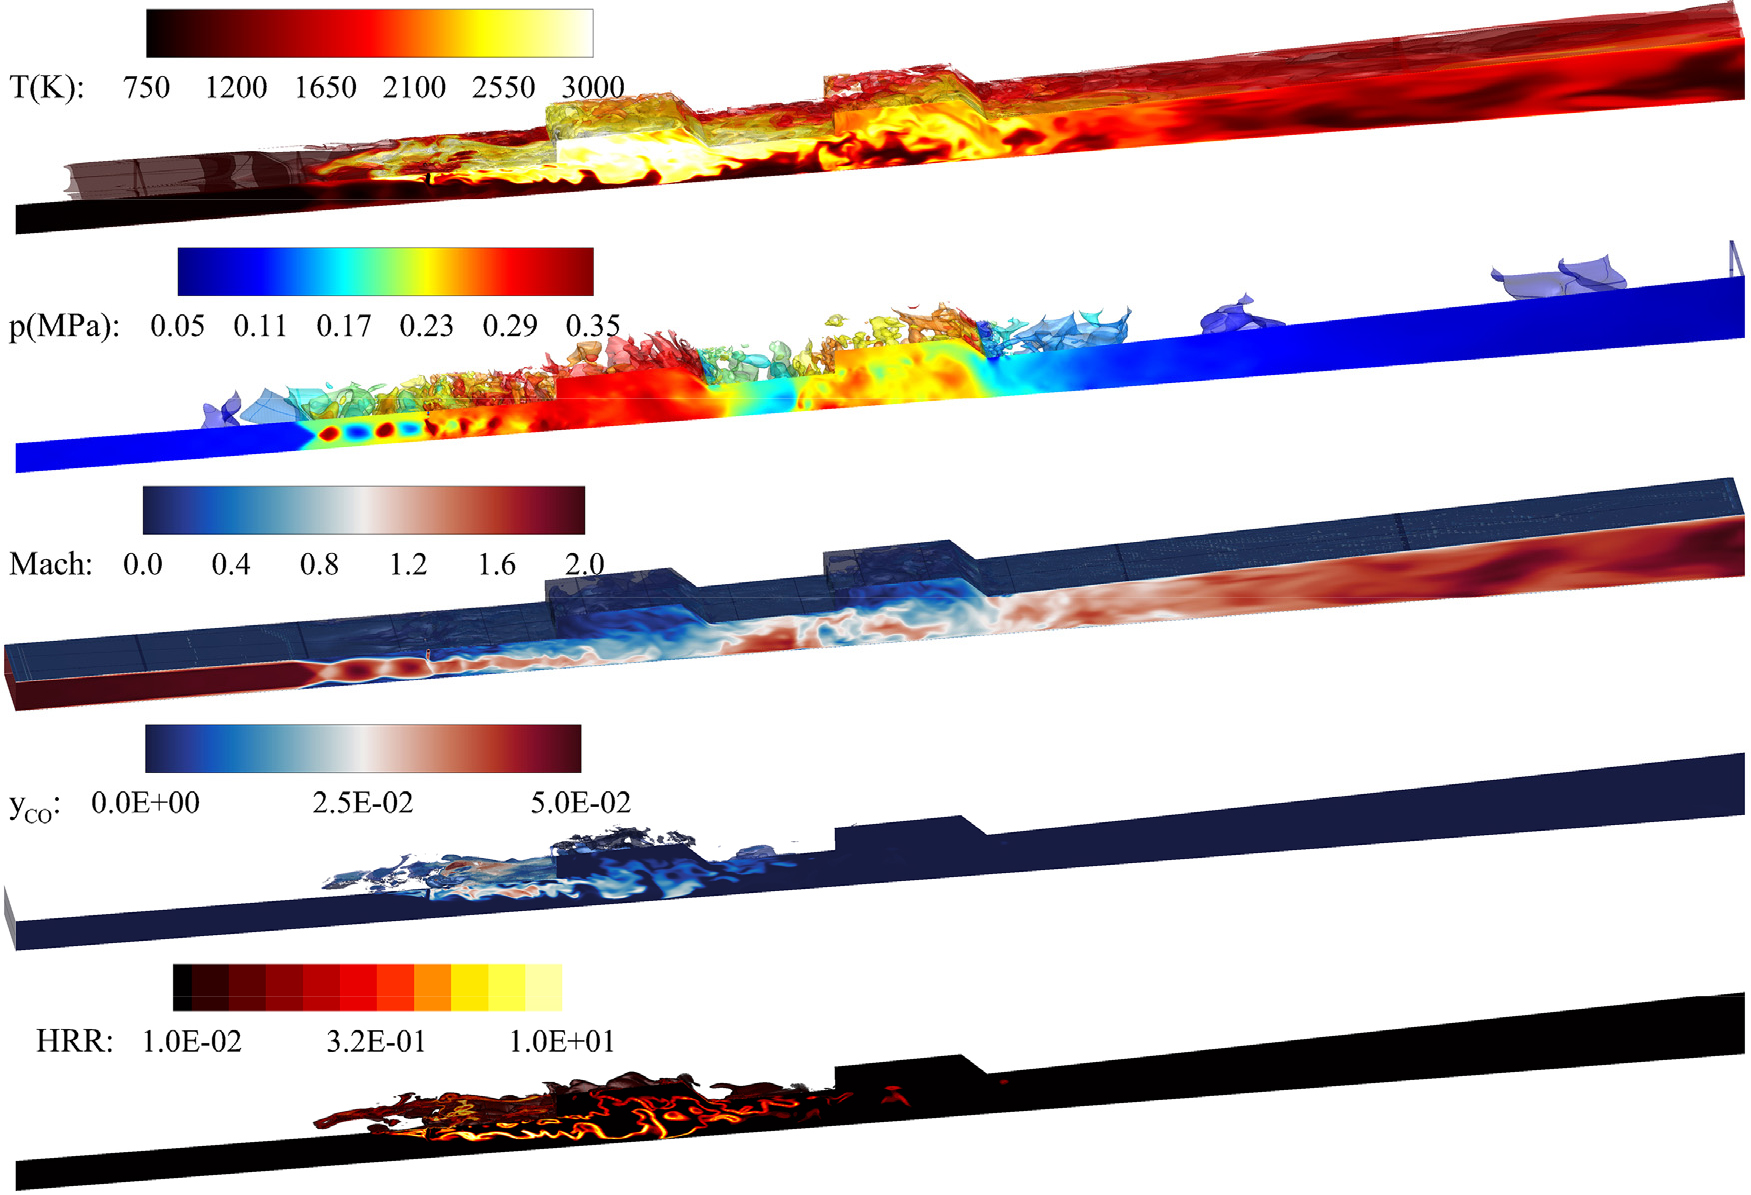
Combustion simulation was initiated after 4.0 ms, when the supersonic flow field inside the combustor was fully stabilized. The simulation was conducted from 4.0 ms to approximately 9.0 ms, thereby ensuring results encompassing at least 15 Flow-Through Times (FTTs). The reactive flow field results at a global equivalence ratio of 0.24 are presented in Fig. 3. Most of the reaction and the Heat Release Rate (HRR) are concentrated within the first cavity close-out region. Strong combustion pressure develops in the first cavity, and a pre-combustion shock wave forms in the isolator. Upon traveling the pre-combustion shock wave, the flow decelerates to subsonic speeds, accompanied by thermal choking in the first cavity close-out region. Subsequently, the flow re-accelerates to sonic speeds in the second cavity close-out region. The formation of a complete pre-combustion shock wave within the isolator signifies flow field characteristics of a transition to complete RAM mode, and as a consequence of these characteristics, a substantial portion of the fuel is consumed. This phenomenon is further substantiated by the concentration of the intermediate product CO, which is anchored from the fuel injector to the first cavity region. Localized regions within the combustor reach temperatures of approximately 2,800 K, predominantly distributed near the first cavity region.
This observation suggests a potential limitation inherent in the simplified laminar chemical reaction mechanism, specifically the CO-CO2 reaction, in accurately predicting flame temperature.
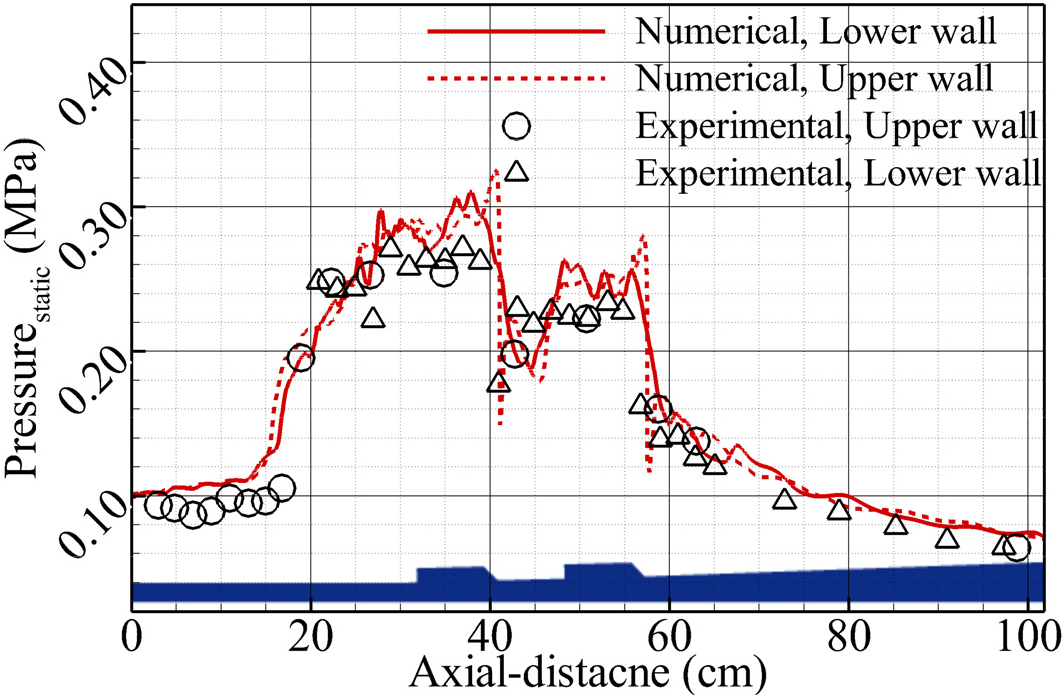
Nevertheless, Fig. 4, which depicts the wall static pressure distributions with experimental data, indicates that the numerical simulations yield results within an acceptable range. Although the numerical results somewhat overpredict the combustion pressure anchored in the first and second cavity close-out regions compared to the experiment results, it accurately captures the trend of pressure increase and decrease. Furthermore, the leading-edge location of the pre-combustion shock waves is also well-predicted. Therefore, it is considered that the numerical results accurately simulate the wall static pressure distributions, and there are no issues in utilizing them for p-CHT analysis.
3.2 Results of the pseudo-Conjugate Heat Transfer Analysis with Combustion Test
The p-CHT analysis, based on wall temperature data derived from the combustion simulation, was conducted under the assumption that the combustion experiment lasted 60 seconds. Consequently, a sampling time of 60 seconds was acquired, and the results corresponding to the 1 second, 15 second, 30 seconds, 45 seconds and 60 seconds are shown in Fig. 5, 6, 7, 8, 9.
As the experiment proceeds, the cavity close-out region emerges as the location of peak structural temperature concentration. This is suggested that flames are primarily formed on the upper wall where the fuel injector is located, and due to the configuration of the cavity, the total surface area of the structure exposed to the high-temperature flow field is higher than in other regions. Furthermore, among the two cavities, an elevated temperature field is observed within the first cavity, encompassing the region upstream to the isolator exit. While elevated temperatures are distributed across the upper panel of the combustor, the lower panel experiences temperature increases predominantly in the downstream region of the combustor. It can be seen that the amount of heating on the lower panel is also smaller compared to the upper panel. In the center plane results across all time periods, temperature difference between the upper and lower panels is apparent, becoming notably more significant when the combustion experiment is maintained for 30 seconds or 60 seconds, the difference becomes significantly more pronounced.
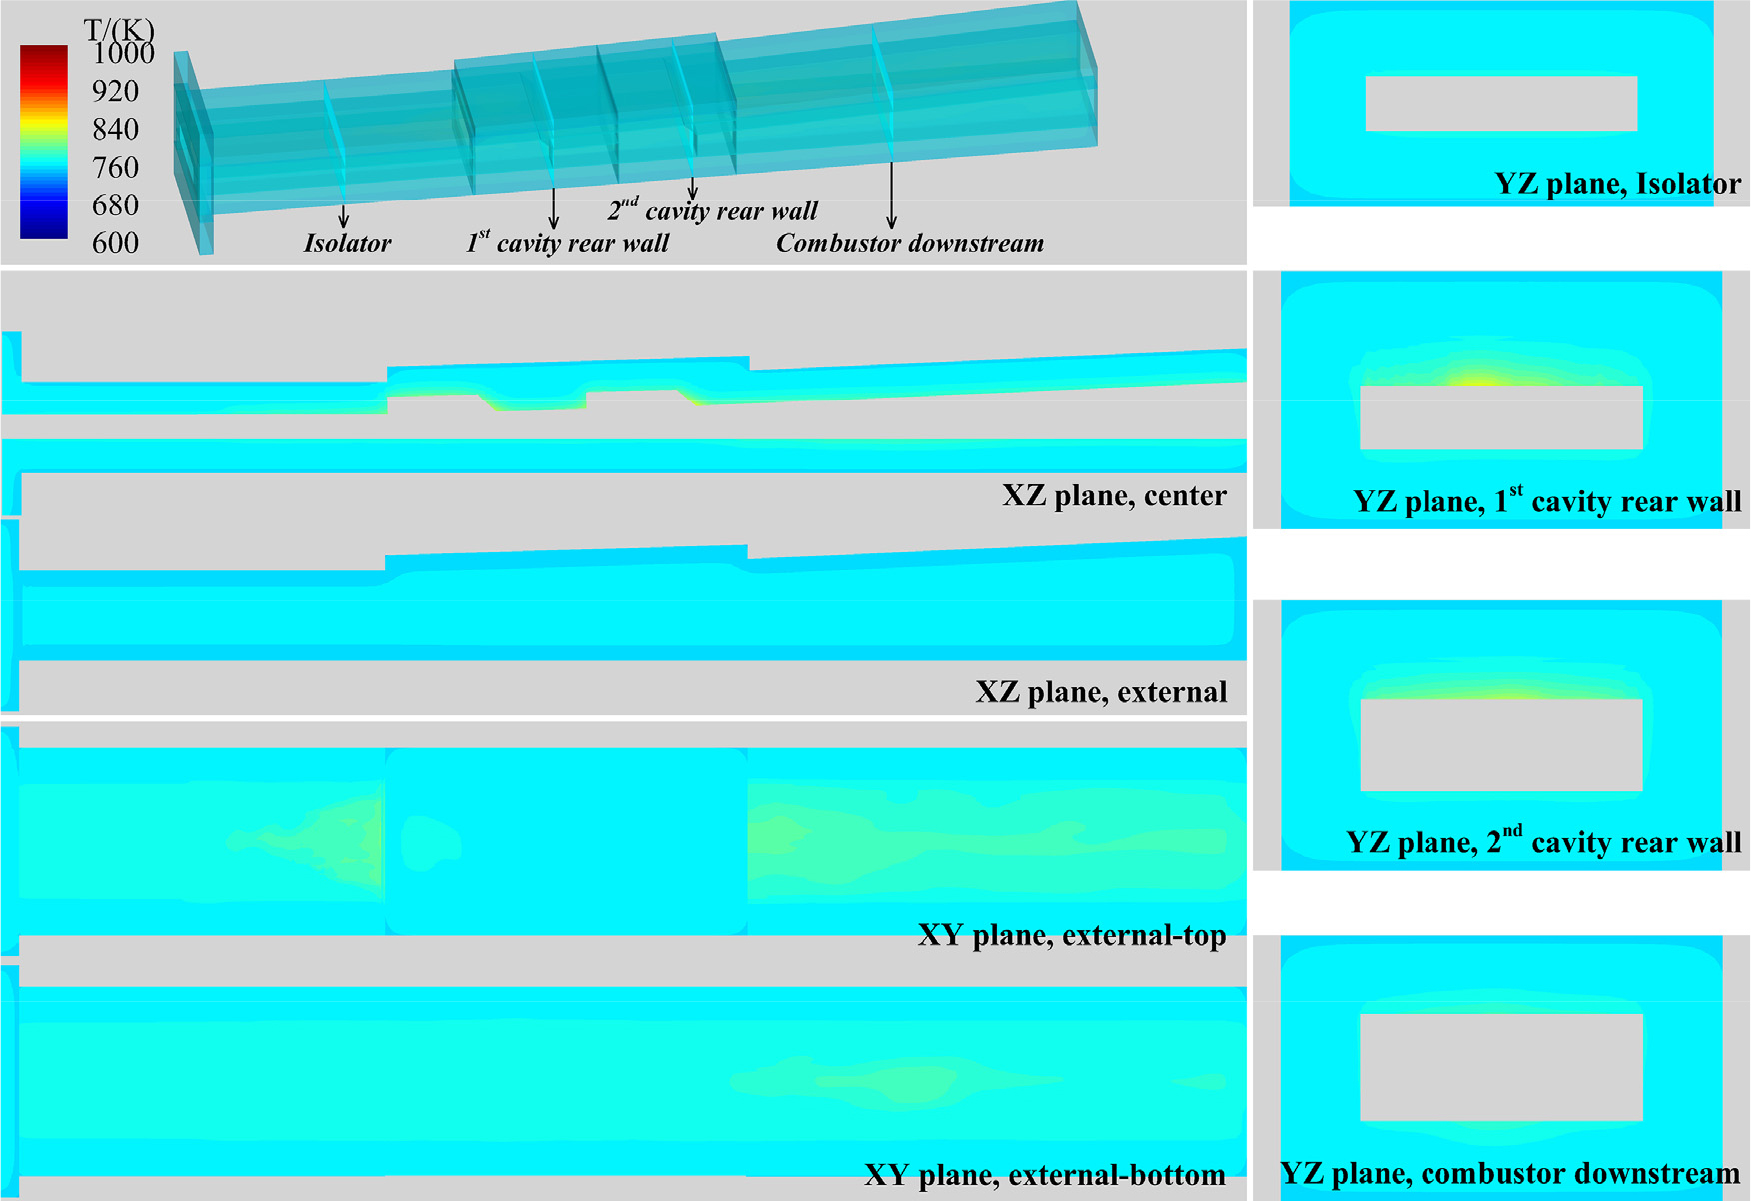
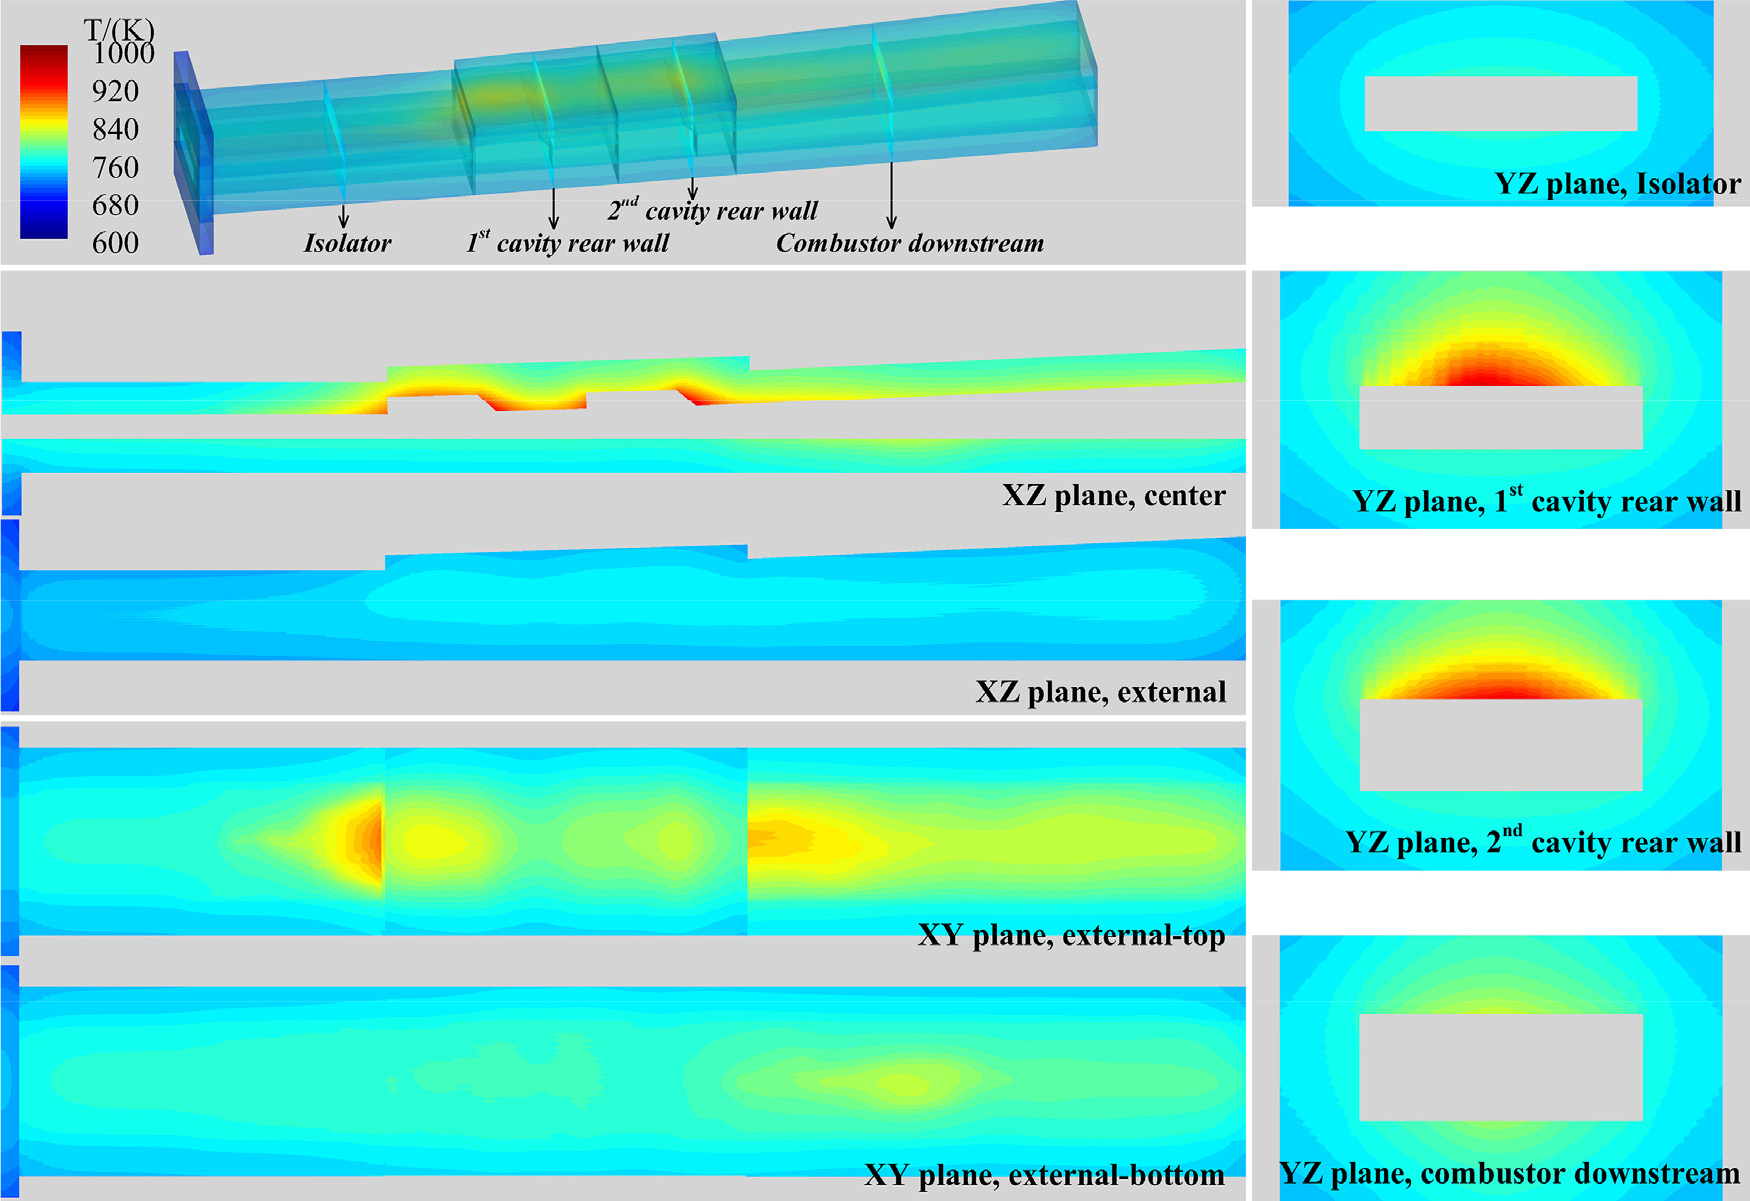
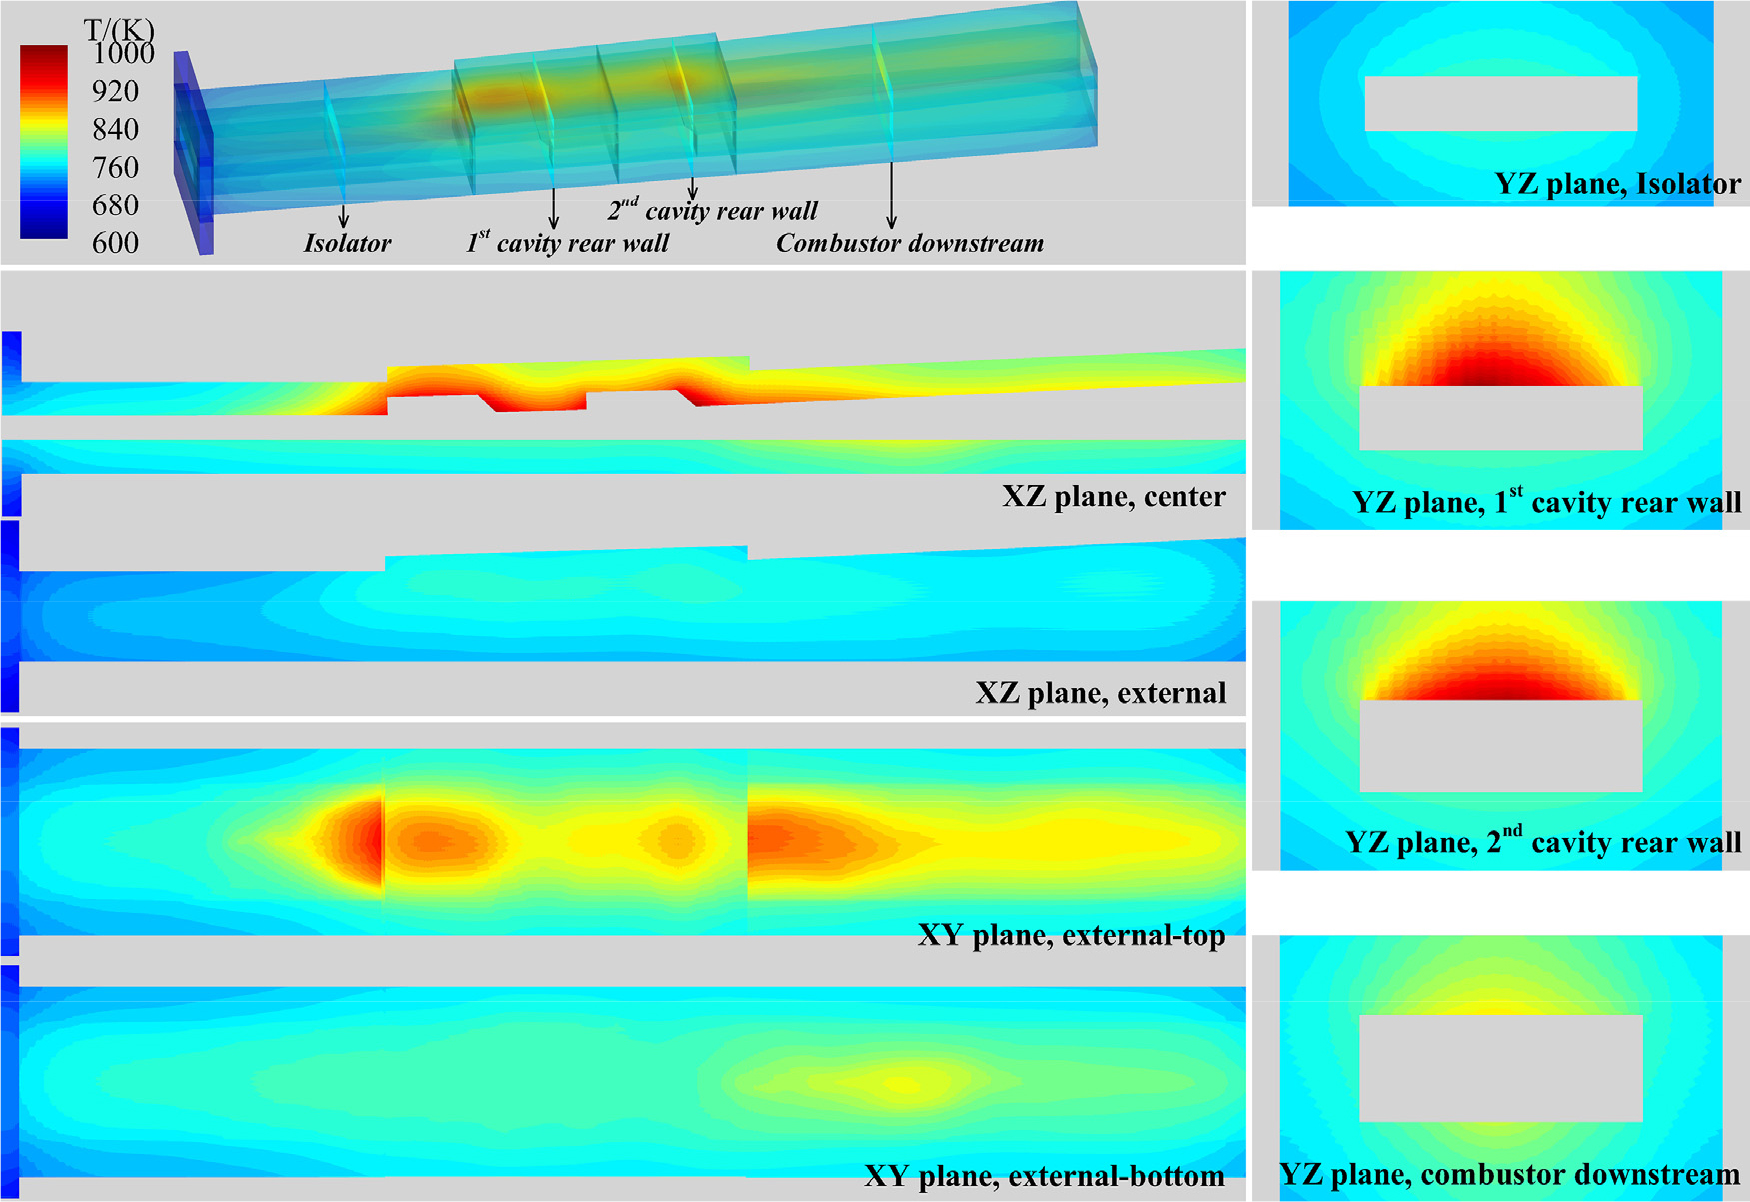
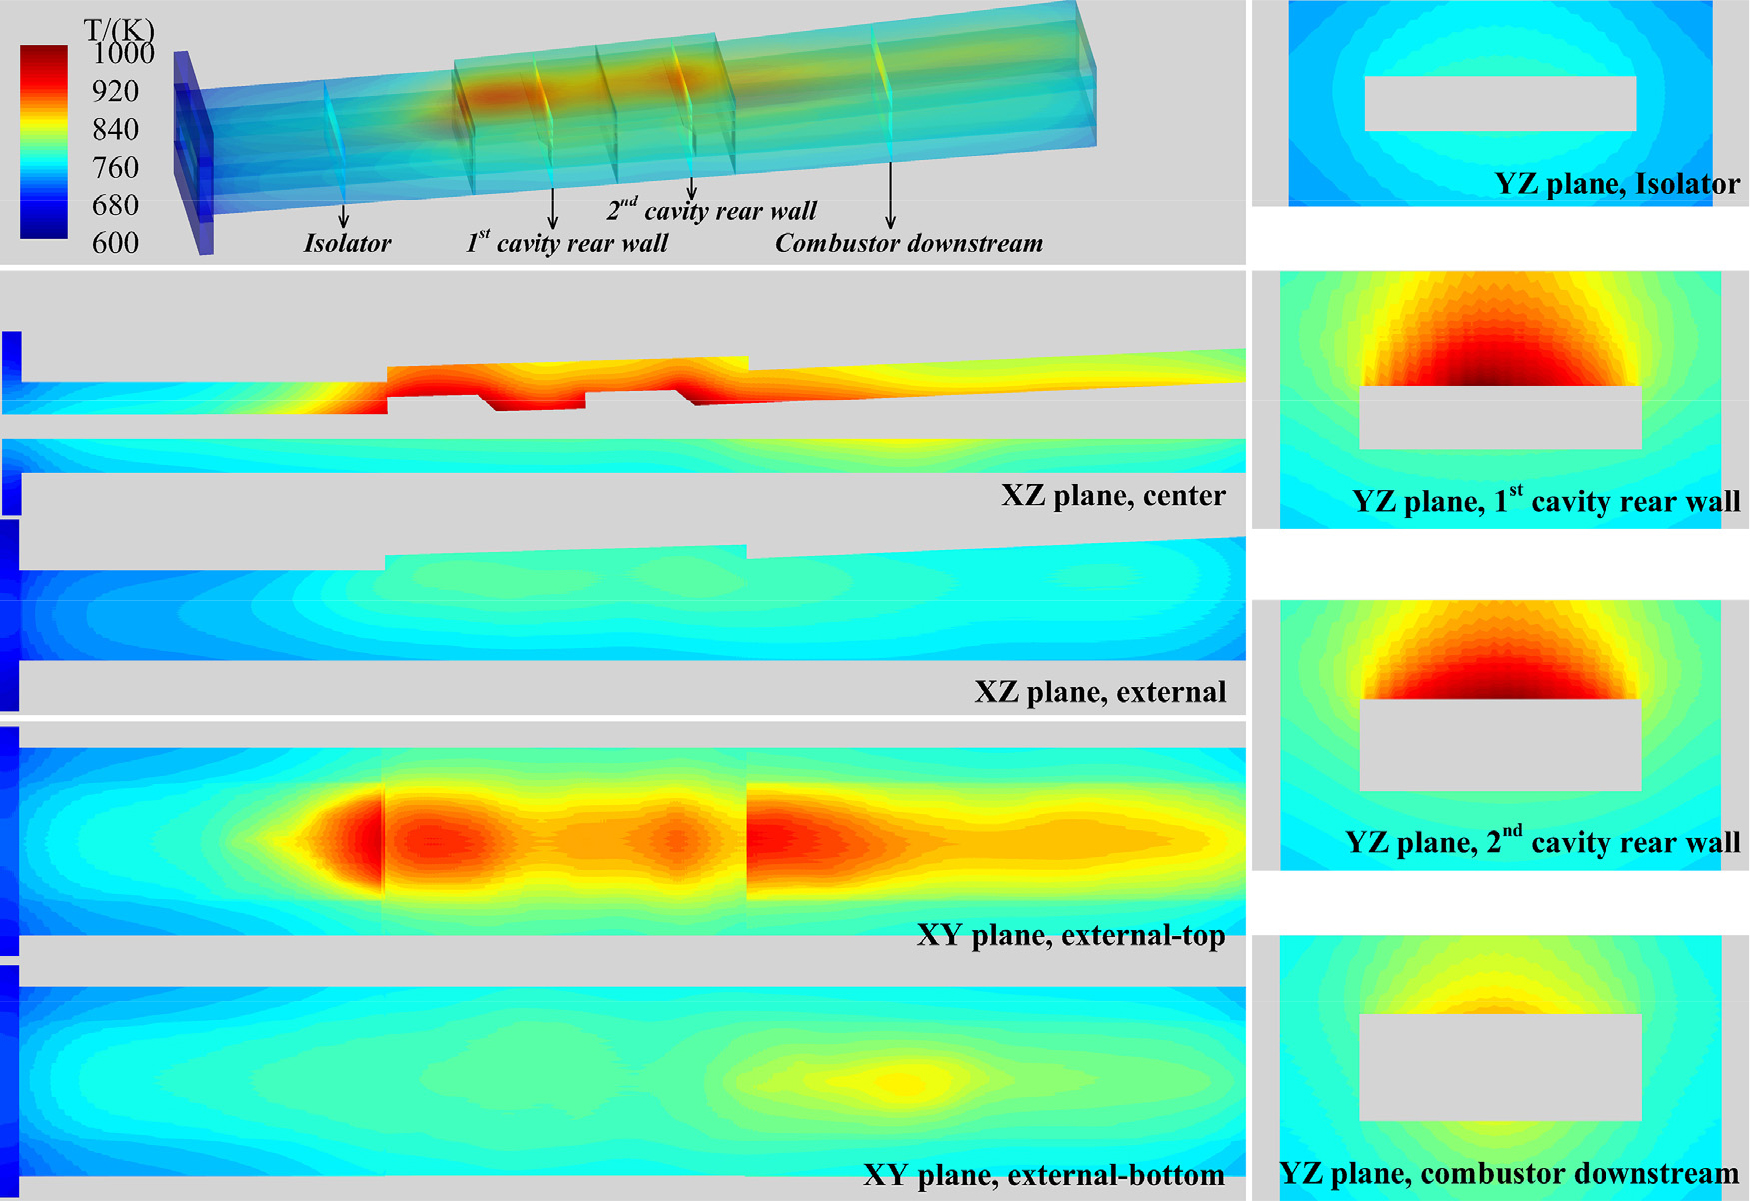
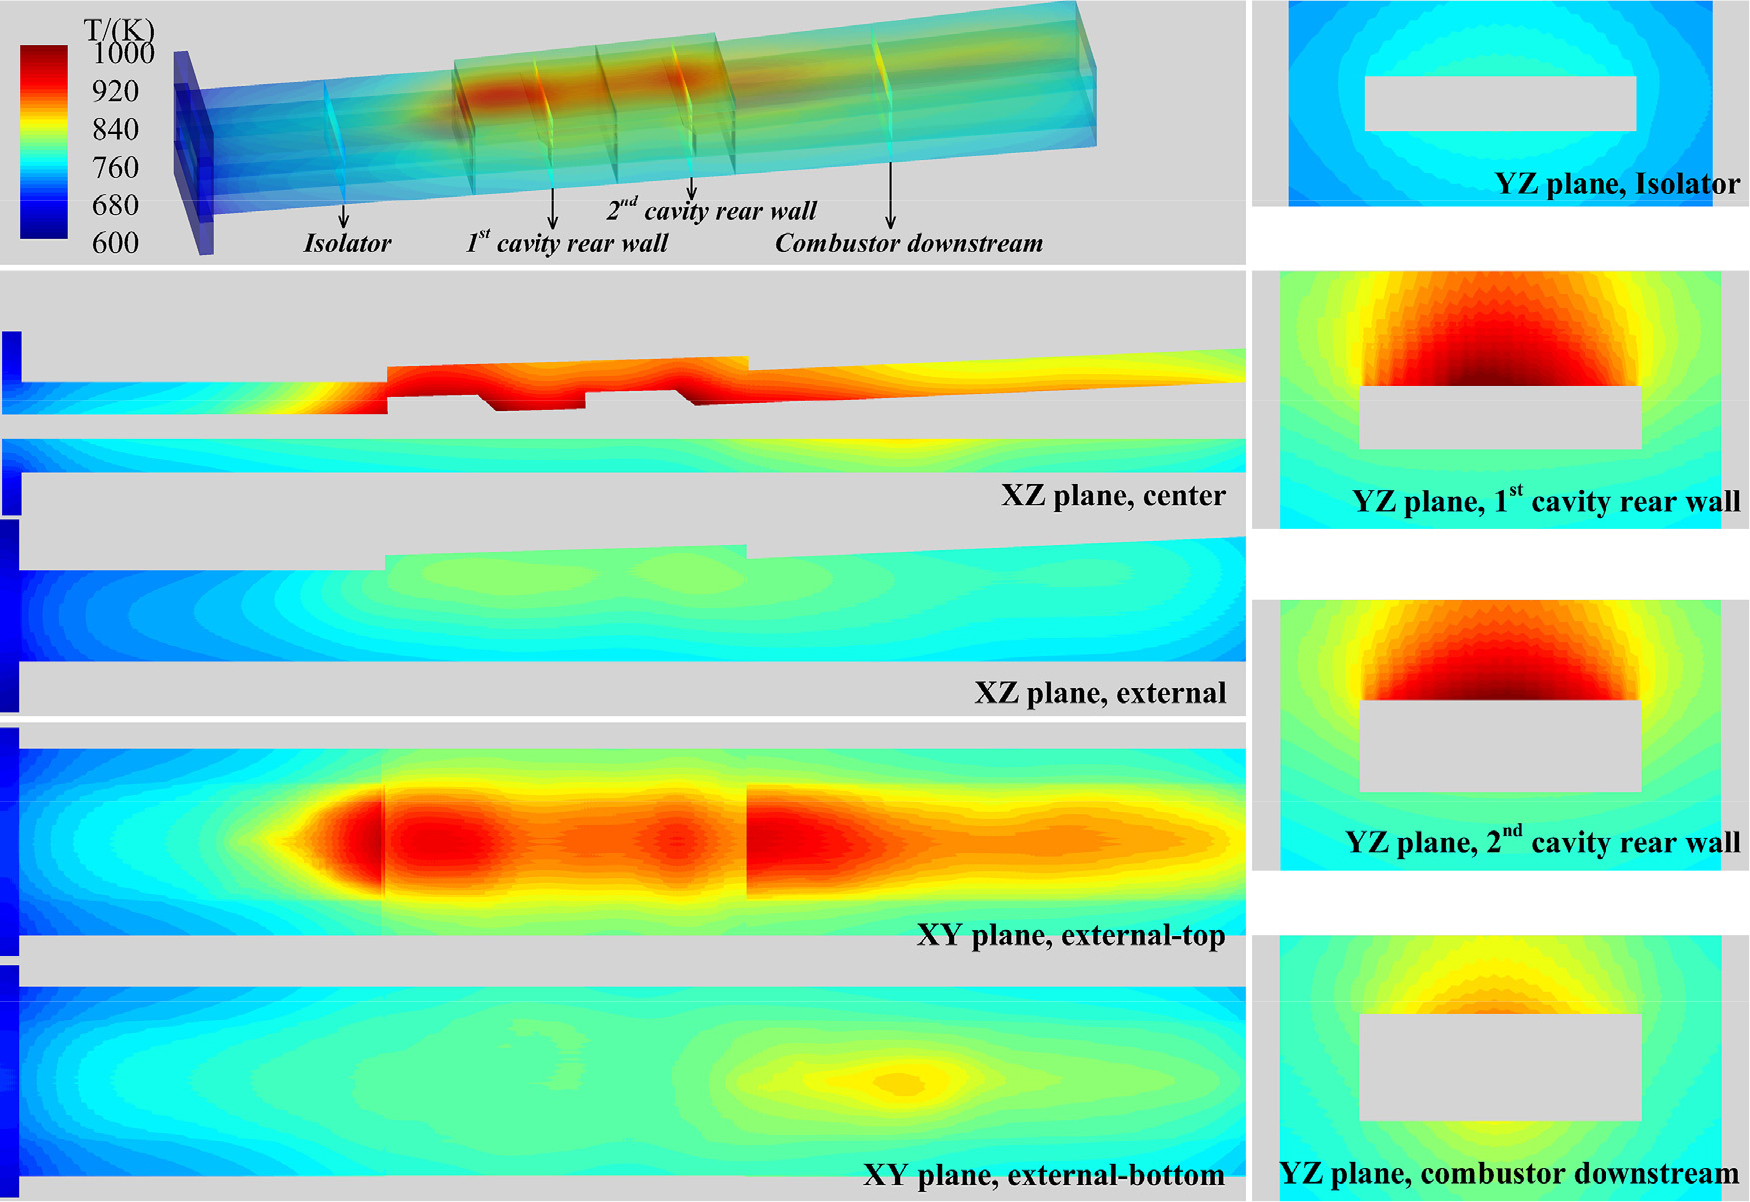
Furthermore, examination of the results from the top and bottom surfaces, as well as each cross-sectional plane presented in Fig. 5, 6, 7, 8, 9, reveals a high-temperature distribution along the centerline of the upper panel within the combustor. It is evident that the region extending from the fuel injector to the first cavity is subjected to a severe thermal environment characterized by concentrated heat load. In contrast, the sidewall regions, owing to their relatively large surface areas exposed to the external environment, exhibit a lower temperature distribution. The p-CHT analysis findings, highlighting localized extreme temperature gradients, raise concerns regarding potential possibility of structural issues. In fact, for longer combustor designs, structural failures have been observed due to heat load concentration on the welds of the heat exchangers integrated into the upper and lower panels.
Fig. 10 illustrates the temperature distribution of the upper and lower panels over time on the internal (inner-side) surface from the p-CHT analysis results. Each contour line represents a 5-second time interval. The temperature of the lower panel rises from an initial temperature of 755 K to a peak of 850 K over the 60-second combustion experiment. The peak temperature distribution, reaching 850 K, is observed in the combustor downstream. This distribution originates from the extension of the flame structure toward the combustor lower wall side, which is induced by the rear wall of the second cavity.Except for the inlet flange, the lowest wall temperature on the lower panel is observed in the second cavity close-out region and is approximately 780 K. Consequently, the temperature difference between the maximum and minimum value on the lower panel amounts to approximately 70 K.
In contrast, the upper panel experiences a pronounced temperature gradient along the axial-direction of the combustor. Although the combustor exhibits a transition to ram mode accompanied by thermal choking—as evidenced by a clearly developed pre-combustion shock train within the isolator region—most of the flame structure forms along the upper panel where the fuel injectors are located. The upper panel temperature escalates from 755 K to about 1,020 K throughout the 60-second combustion experiment. This peak temperature of 1,020 K is predominantly concentrated on the rear wall of the second cavity. Subsequently, it decreases to about 920 K at the front wall of the second cavity and then increases again to approximately 1,040 K. The peak temperature diminishes to 840 K in the combustor-exit region. This severe temperature gradient—spanning 755 K to 1,040 K—demonstrates that structural thermal stress is a primary concern on the upper wall, in contrast to the lower wall. Although the melting point of STS316L (≈ 1 700 K) is not reached, the pronounced local temperature gradients pose a serious risk of welding point damage in both the cavity and heat-exchanger regions.
Also, the results in Fig. 10 show that the temperature difference between the upper and lower panels in the central part of the combustor is dependent on the flame structure and exhibits a temperature gradient of approximately 300 K or higher.
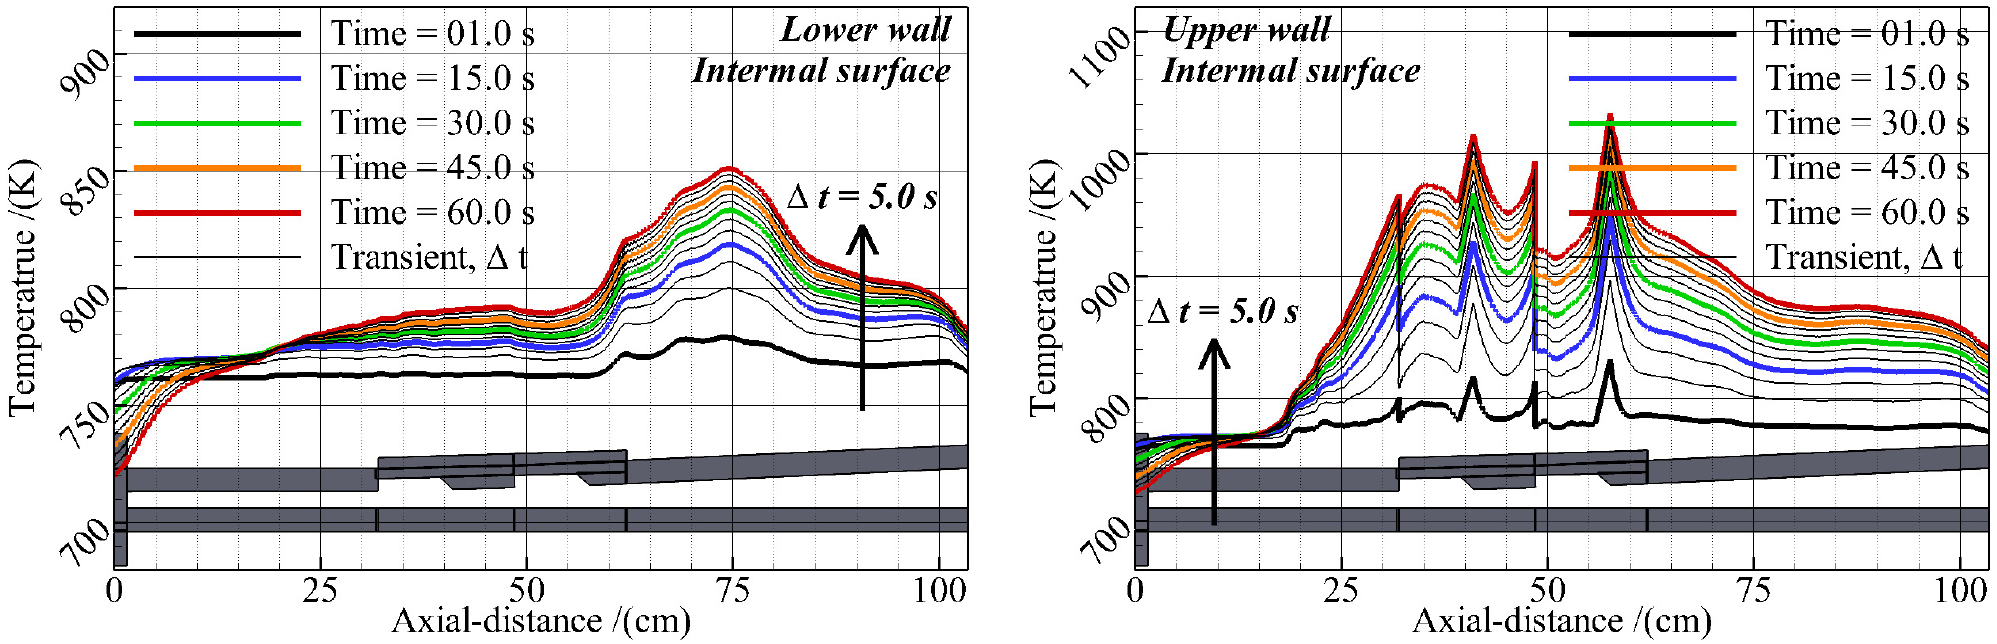
Fig. 11 compares the gas temperature in the near wall region and the wall temperature obtained from the combustion simulation on the upper and lower plates with the wall temperature derived from the p-CHT analysis. Therefore, Fig. 11 provides a quantitative comparison between wall temperature calculations from the combustion simulation (performed with non-catalytic and no-slip adiabatic wall conditions), near-wall gas temperatures, and wall temperatures obtained from the p-CHT analysis of convective and conductive heat transfer.
The wall and gas temperatures obtained from the combustion simulation reveal a peak temperature distribution of approximately 2,600 K extending from the isolator exit to the first cavity close-out region. The disparity between wall and gas temperatures is less than 100 K. And this temperature difference is not observed within the high-temperature cavity close-out region, but rather emerges in the downstream region of the combustor.
The peak-temperature locations predicted by the combustion-only simulation differ markedly from those obtained from the p-CHT analysis results, with the discrepancy being most pronounced on the upper panel. In the combustion simulation, the maximum wall temperature of about 2,700 K on the upper panel appears inside the first cavity close-out region, whereas in the p-CHT results the highest temperature of about 1,040 K is anchored to the rear wall of the second cavity; the same wall position reaches only ~ 1,800 K in the combustion simulation case. This mismatch indicates a decoupling between the temperature field and the wall temperature of the p-CHT results and highlights the controlling role of the local conductivity by the convective of the combustion field, which is dictated by the flame structure. Because final products possess higher conductivity than either intermediate species or the oxidizer, and because the net heat flux scales with the surface area attached by the gas. Therefore, the results in Fig. 11 are the combined consequence of the temperature field, flame topology, and geometric configuration. This behavior is governed by the flame structure. Consequently, under a cavity-shear-layer-assisted combustion mode, in which the flame is concentrated on the rear wall of cavity, i.e. when the combustor operates in scramjet mode, the structural temperature of that wall could rise even further above its present level.
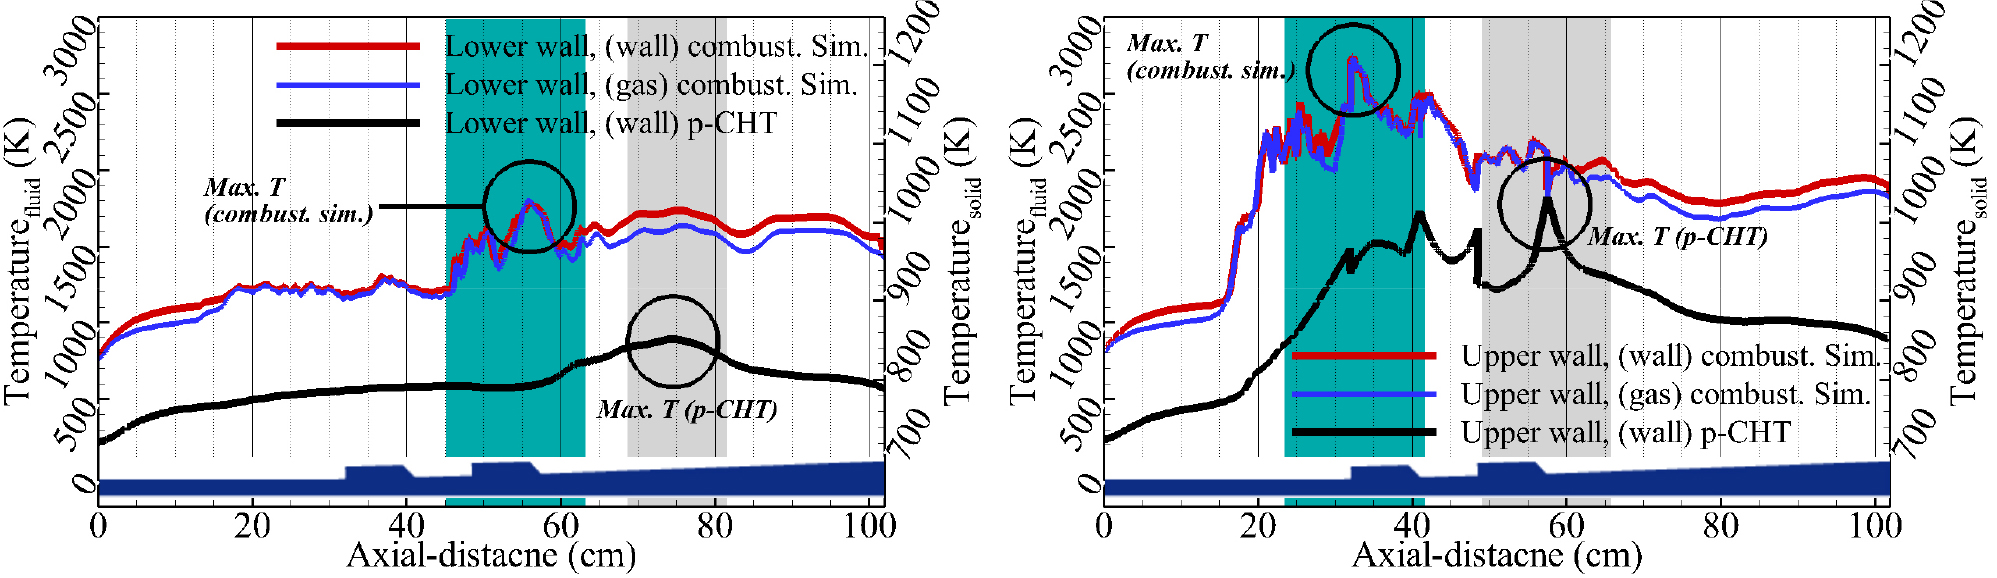
Fig. 11.
Comparison of wall temperature distribution of the inner sides of the upper and lower panels along the central axis: (Red) adiabatic wall temperature and (Blue) gas temperature at a location 1 mm away from the wall in combustion simulation, (Black) wall temperature from p-CHT analysis at 60.0 s.
4. Conclusion
In this study, a conjugated heat transfer (CHT) analysis, incorporating reacting flow fields within a scramjet combustor, was conducted. To reflect ground combustion test durations on the order of tens of seconds, a pseudo-CHT approach was developed. This approach involved solving the reacting flow field using combustion simulation and subsequently employing these results for heat transfer analysis on the combustor structure. The target combustor model was a direct-connect tandem cavity kerosene-fueled scramjet combustor, for which ground combustion tests were performed at the Korea Aerospace Research Institute (KARI). Combustion simulations were executed using the finite-rate chemistry (FRC) and an Improved Delayed Detached Eddy Simulation (IDDES) model with a high-resolution spatial accuracy scheme. Wall temperature data derived from these combustion simulations were then used as input for the p-CHT analysis, yielding a 60-second sampling time.
The p-CHT analysis revealed that heat flux was concentrated on the rear wall of the second cavity of the upper wall, resulting in a temperature distribution reaching approximately 1,040 K. Due to the flame concentrated in the upper panel of the combustor, the lower wall exhibited a relatively low temperature distribution, with the maximum temperature reaching approximately 850 K. The temperature gradients between the upper and lower walls, together with the extreme gradients present within each wall indicated that structural instability issues in the heat exchanger could be induced. Furthermore, the wall-temperature distributions obtained from both the combustion-only and p-CHT simulations demonstrate that the structural wall temperature is governed coupled characteristics by the flame structure, the fluid temperature field, and the geometric configuration. These results imply that, under low-equivalence ratio conditions where the cavity-assisted combustion prevails, the rear wall of the cavity may experience higher thermal loads than it does at higher equivalence ratios. Consequently, it suggests that comprehensive combustion and p-CHT analyses should be extended to a broad range of equivalence ratios. The findings have demonstrated that the proposed p-CHT analysis effectively enables investigating the thermal environments of structure over timescales relevant to scramjet combustor ground testing (tens of seconds). And it shows that valuable data for the heat exchanger design and optimization can be generated with p-CHT analysis.
