

1. Introduction
2. Methodology
2.1 Experimental setup
2.2 Background-oriented schlieren
2.3 Case description
3. Result and Discussion
3.1 Background-oriented schlieren of counterflow flame
3.2 Feasibility of BOS for non-premixed flame analysis
3.3 Potential applications of BOS in non-premixed flames
4. Conclusion
1. Introduction
Schlieren imaging, a representative optical technique for visualizing density gradients induced by compression and expansion, has been widely used in aerodynamics. The schlieren method visualizes density gradients by converting light deflection caused by refractive index gradients into intensity variations. The refractive index of a gas can be expressed as a function of density and specific refractivity through the Gladstone-Dale relation. Accordingly, density and composition gradients formed during mixing and heating appear as refractive index gradients, enabling identification of regions where mixing and heating are active. However, conventional schlieren systems require large optical components and precise alignment, which can limit their applicability in combustion environments involving multiple diagnostics. Moreover, the conversion of light deflection into intensity variations inherently limits the quantitative evaluation of the gradients. BOS (Background-Oriented Schlieren) is an optical diagnostic technique that reconstructs density gradient fields by extracting image displacements of a background pattern using digital image correlation and converting them into light deflection angles. Unlike conventional schlieren, BOS does not require optical elements such as spherical mirrors or a knife edge, providing a relatively simple configuration. BOS enables estimation of light deflection magnitude, providing a basis for quantitative evaluation of density gradients.
From a flame diagnostics perspective, BOS has been applied to various premixed configurations, including three-dimensional flame visualization using multiple cameras [1,2]. Grauer et al. [1] first investigated three-dimensional reconstructions of the refractive index field in a Bunsen flame. Liu et al. [2] compared reconstruction methods and investigated the three-dimensional temperature distribution of a Bunsen flame. Wahls and Ekkad [3] also measured the temperature of a Bunsen flame using BOS and investigated the effects of random signal noise. Tasmany et al. [4] applied BOS to a premixed swirl flame with thermoacoustic instability to measure density fluctuations. Cakir et al. [5] measured the laminar burning speed in conical flames by identifying reaction zones using BOS.
Previous studies have primarily focused on premixed flames, whereas practical combustors widely employ non-premixed or partially premixed systems, highlighting the need to extend BOS to non-premixed flames. The counterflow diffusion flame, a canonical strained non-premixed configuration with opposing streams of different compositions, produces strong mixture fraction variations and pronounced density gradients near the mixing layer, closely approximating an ideal one-dimensional diffusion flame. In premixed flames, mixing is completed prior to reaction, limiting composition uncertainty only to the thin inner flame structure, typically on the order of O(100) µm. Consequently, refractive index variations are governed primarily by density changes induced by thermal expansion. In contrast, non-premixed configurations involve coupled compositional and thermal effects on the refractive index prior to complete reaction, requiring appropriate modeling of composition-dependent refractive index variations for quantitative reconstruction.
In this study, BOS is applied to a counterflow burner to characterize the refractive index field and to identify mixing and preheating regions, demonstrating its potential for quantitative analysis. For this, nitrogen diluted methane and oxygen diffusion flames are considered, and the resulting displacement field is compared with the corresponding one-dimensional numerical solution.
2. Methodology
2.1 Experimental setup
The experimental setup for the counterflow burner and BOS measurement is shown in Fig. 1. In the counterflow burner, CH4/N2 fuel (bottom) and O2/N2 oxidizer (top) are injected through the main nozzles (Dnozzle = 2 cm). To suppress ambient entrainment and shear layer formation, a nitrogen coflow is supplied through an annular nozzle (Dout = 4 cm, Din = 2 cm). Flow rates are controlled using mass flow controllers (Line Tech), calibrated using a volumetric flow calibrator (Defender 520M, accuracy ±1%). A checkerboard background pattern is placed behind the burner at a distance of 15 cm from the main nozzle center. The background is illuminated by a white LED light source, which emits broadband visible light over approximately 420-770 nm.
Deformed images are recorded using a high-speed camera (Phantom TMX-6410) positioned 170 cm from the main nozzle center. A 200 mm focal length lens (f/32) is used for imaging. In the schematic, undeflected ray paths are shown in black, while deflected ray paths due to the density gradient field are indicated in red. The raw image consists of 1024 × 256 pixels with a physical resolution of 0.1469 mm/pixel. The exposure time for each frame was 100 µs at a frame rate of 100 Hz.
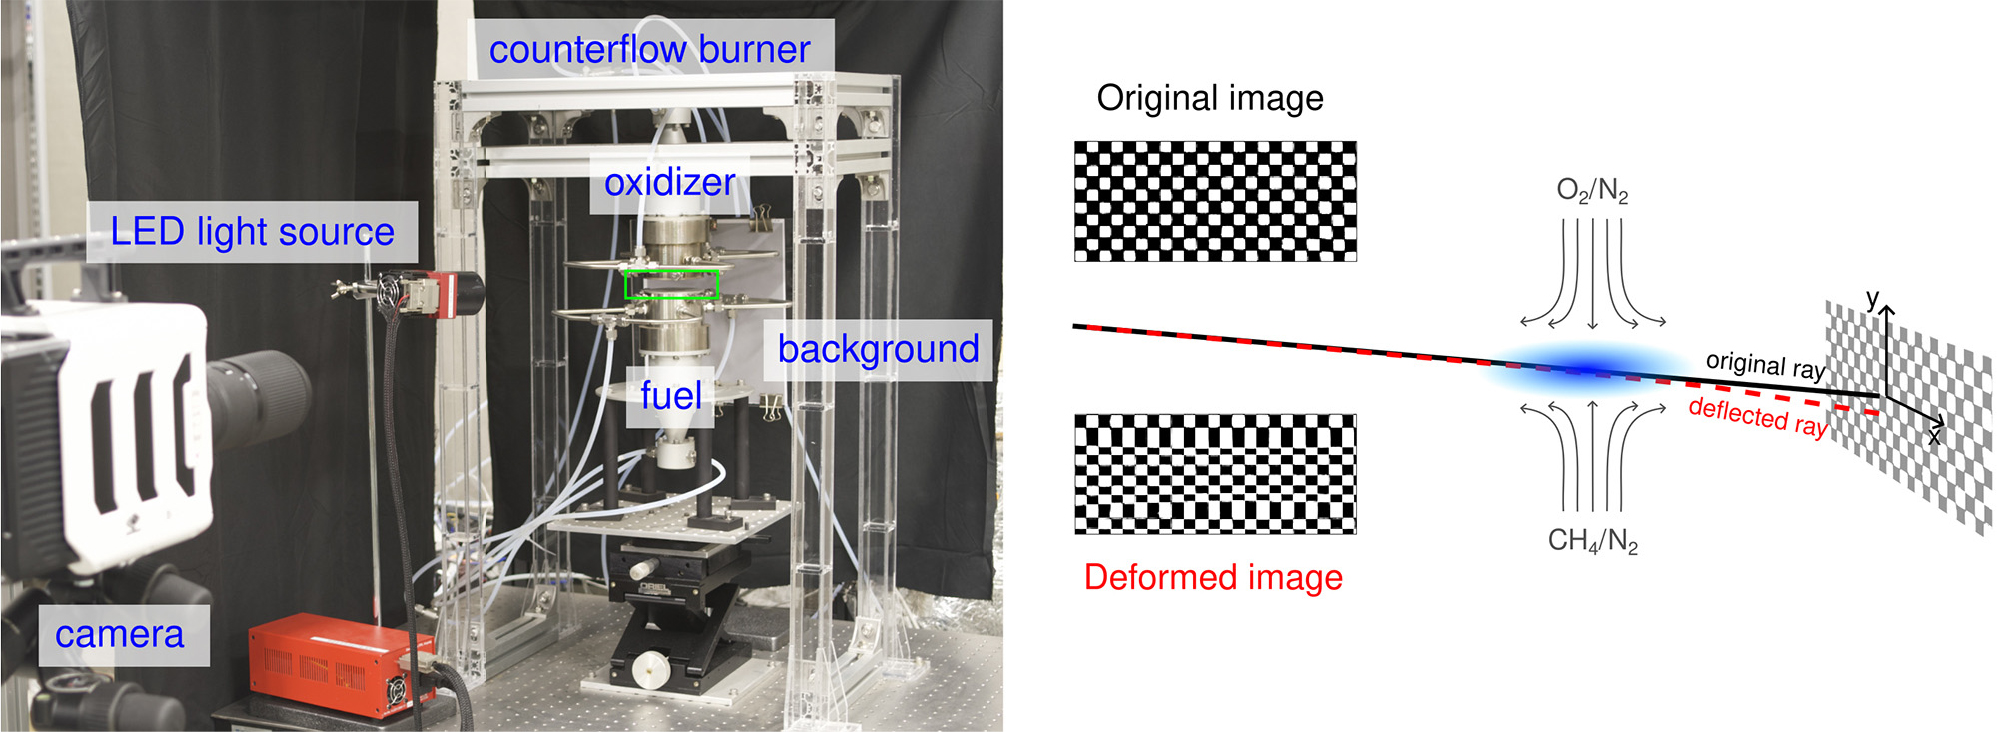
2.2 Background-oriented schlieren
The density gradient is inferred from the displacement of the background pattern. The displacement field is obtained by comparing background images before and after deformation induced by the flame. In this study, a Fourier transform based FCD (Fast Checkerboard Demodulation) method is employed [6], where a periodic background pattern is used to quantify apparent displacement via phase variations in Fourier space. Compared to conventional cross-correlation based methods widely used in PIV (Particle Image Velocimetry), FCD remains robust under relatively large displacement conditions such as those encountered in flames. If the background pattern scale is excessively small relative to the deformation, displacement extraction becomes unstable. Therefore, an appropriate pattern size is determined through trial and error, and a checkerboard with a grid size of 0.94 mm is used in this study. Since the FCD analysis is performed pixel-wise, the calculated displacement field retains the same spatial resolution as the original image (0.1469 mm/pixel). However, high-frequency spatial modes are filtered during the Fourier demodulation process due to the finite carrier-filter window associated with the background pattern scale. Therefore, an appropriate pattern scale should be selected according to the characteristic physical scale of the target phenomenon. In the present study, the filtering window in wavenumber space was = 0.49, corresponding approximately to the physical scale of the checkerboard grid. Signals with spatial scales smaller than this characteristic scale are filtered during the processing. From the ray equation, the integrated form along the ray path is given by Eq. (1), where denotes the apparent deflection in the axial direction, which is a background-plane displacement in physical space.
Here, 𝐿 is the distance between the background and the nozzle axis, is the refractive index of the ambient gas, and 𝑠 is the arc length along the ray path. In Eq. (1), the paraxial approximation is applied. The maximum ray deflection angle in the present configuration was estimated to be 0.39°, which is sufficiently small for the approximation to remain valid. In the present counterflow configuration, the flame structure is one-dimensional along the axial direction, and refractive index variations in the radial direction are negligible compared with the axial refractive index gradient. Therefore, only the y-direction displacement was considered.
The refractive index is modeled as a function of gas composition and temperature using the Gladstone-Dale relation, as given by Eq. (2). In this relation, is the refractive index, 𝜌 is the gas density, and is the Gladstone-Dale coefficient, evaluated as a species mass-weighted average. The Gladstone-Dale coefficient was used for calculating the refractive index gradient of one-dimensional simulation. The Gladstone-Dale coefficient of individual species are listed in Table 1[7]. Over the spectral range of the LED source (420-770 nm), the variation of the Gladstone-Dale coefficient relative to the values listed in Table 1 was estimated to be within approximately 3%, and the values were therefore used throughout the present study.
Table 1.
Gladstone-Dale coefficients of individual gas species [7]
| Species | [m3/kg] | Species | [m3/kg] |
| CH4 | 6.15 × 10⁻⁴ | H2O | 3.12 × 10⁻⁴ |
| O2 | 1.89 × 10⁻⁴ | CO2 | 2.26 × 10⁻⁴ |
| N2 | 2.38 × 10⁻⁴ | CO | 2.67 × 10⁻⁴ |
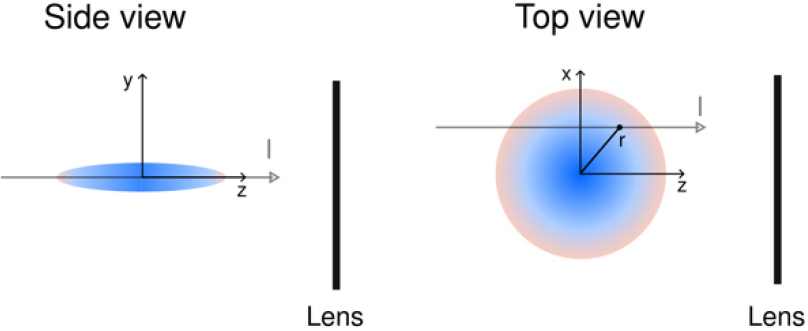
As illustrated in Fig. 2, the measured displacement is line of sight integrated. The Abel inversion is applied to reconstruct the radial distribution of the refractive index gradient under the assumption of axis-symmetry. The Abel inversion is expressed as Eq. (4), where is the line of sight integrated signal and represents the local radial distribution of the refractive index gradient.
For a given axial location y, in Eq. (4) corresponds to the y-direction displacement field , and represents its spatial derivative along the radial direction. Since the present study focuses on the centerline structure, the inverse Abel transformed quantity was obtained with the line of sight integration effect removed.
2.3 Case description
The experimental conditions of the counterflow flame are summarized in Table 2. For all cases, the dilution ratio of fuel, oxidizer, and nitrogen at the stoichiometric mixture fraction is set to 1:2:7.52, corresponding to methane-air combustion. The fuel stream velocity is fixed at 25 cm/s, and the momentum fluxes of the fuel and oxidizer streams are matched, implying that the stagnation plane is located at the center under non-reacting conditions. The experiment was conducted at 293 K and atmospheric pressure. The stoichiometric mixture fraction Zst is varied from 0.3 to 0.7, and nozzle spacings of 1, 1.5, and 2 cm are considered. The corresponding one-dimensional diffusion flame solutions are computed using Cantera software [8], employing the GRI-Mech 3.0 mechanism [9] for methane oxidation.
Table 2.
Properties of the fuel and oxidizer streams and nozzle spacing, using mole fractions
3. Result and Discussion
3.1 Background-oriented schlieren of counterflow flame
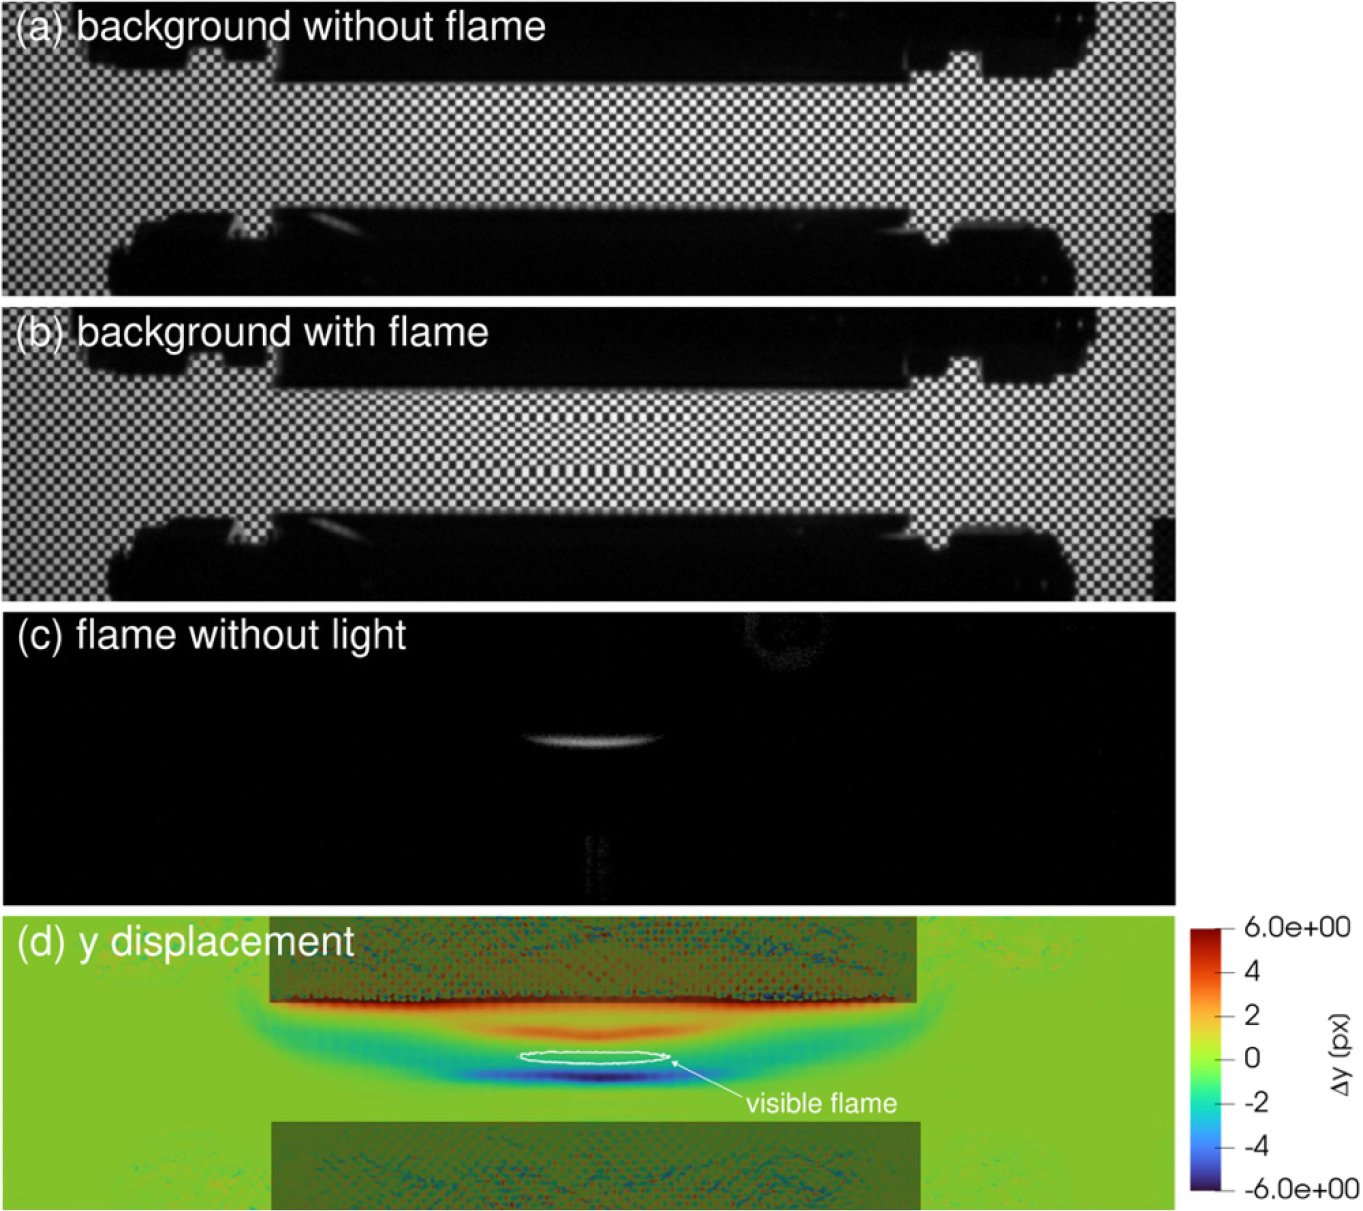
Fig. 3 presents instantaneous images of the counterflow flame with a background pattern: the reference background without flame (a), the distorted background with flame (b), the visible flame image with the light turned off (c), and the processed y-direction displacement field (d). The visible flame contour is overlaid on the image, and the burner wall region is masked for clarity (d). The deformation of the background pattern is clearly observed in the vicinity of the flame. With sufficient illumination, flame luminosity does not affect the background pattern (b). In the y-direction displacement field (d), a strong refractive gradient exists across the flame along the axial direction, and the plume spreads into the surrounding region. Near the flame, the refractive gradient shows minimal variation due to a flattened low-density region caused by thermal expansion.
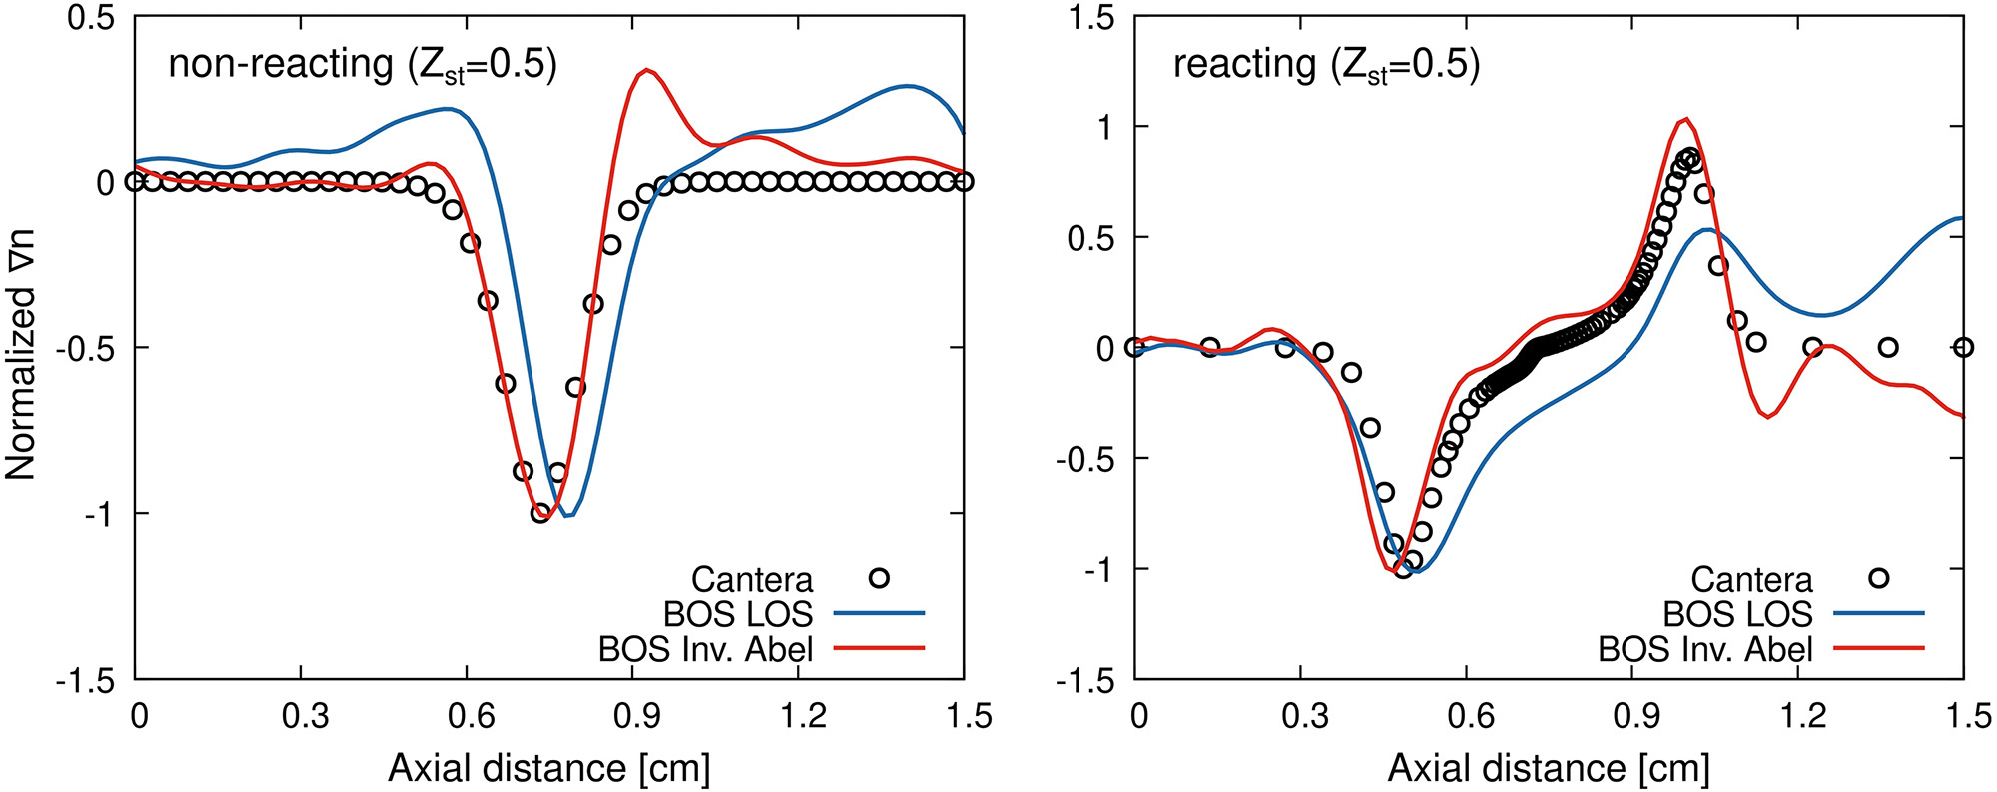
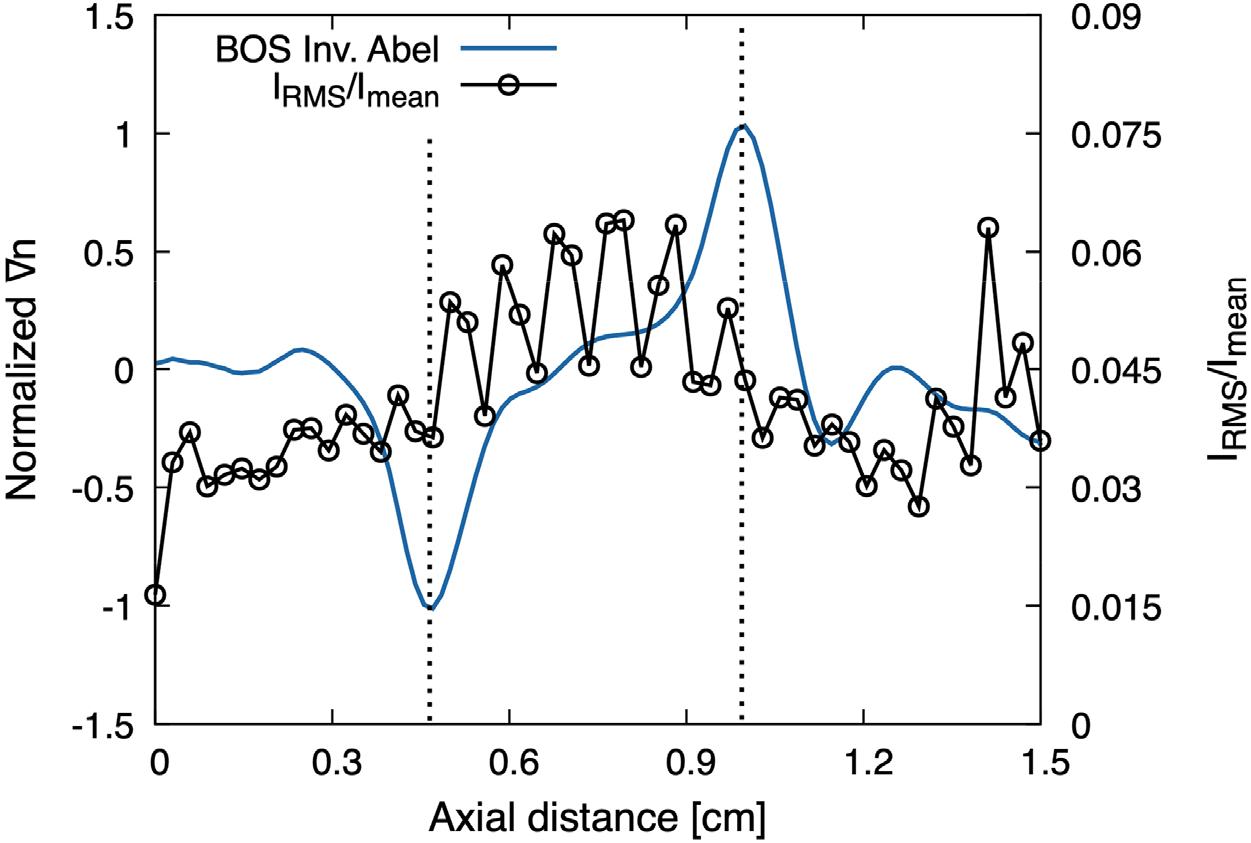
Fig. 4 compares the axial refractive index gradient from the LOS (Line of Sight) signal and the inverse Abel transformation with the corresponding one-dimensional solution of . For comparison, all profiles are normalized by their peak values. The non-reacting case corresponds to a cold flow without ignition. Here, origin (=0) denotes the exit plane of the lower nozzle (fuel side). For all cases, the Abel inversion results show good agreement with the one-dimensional solution in terms of both profile shape and peak location, due to the removal of surrounding refractive field effects. In the non-reacting case, a unidirectional refractive index gradient is observed due to monotonic density variation from fuel oxidizer mixing (), whereas in the reacting case, heat-release-induced thermal expansion produces a density drop near the flame, resulting in two peaks (). There are limitations in predicting the refractive index gradient, including over and undershoots at ≈0.9 (non-reacting case) and ≈1.1 (reacting case), as well as a bias after the extremum. This can be attributed to buoyant plume structures that mask the local refractive index gradient field, particularly near the upper nozzle where the plume is partially blocked and undergoes additional heat loss to the burner head. Although inverse Abel transformation was applied to remove the line of sight contribution, buoyant instability and interaction with the upper burner flow introduce difficulties in satisfying the axisymmetric assumption. To characterize the unsteadiness of plume, the root mean square (RMS) of the raw image intensity fluctuation () at each y-slice was evaluated. The RMS values, normalized by their mean value, were line-averaged over the annular outer region bounded by the burner head, excluding the flame zone, at each y-location. Fig. 5 presents the line-averaged RMS of the raw signal together with the normalized refractive index gradient profiles and the RMS level is high near the flame center and the upper burner wall (1.5 cm), where the hot plume is emitted and blocked. In particular, a locally strong peak is observed near the upper burner wall due to further cooling effects, which appears to influence the Abel-inverted profile at the corresponding location. Near the peak of refractive index gradient profile, the RMS level remains close to the background level, the influence of such unsteadiness on the peak-to-peak distance is expected to be minor. Although discrepancies between the actual flame structure and the one-dimensional numerical solution may also exist, the good agreement near the fuel side (lower nozzle), where plume influence is weaker, suggests that the remaining discrepancy is more closely related to limitations of the Abel inversion process.
3.2 Feasibility of BOS for non-premixed flame analysis
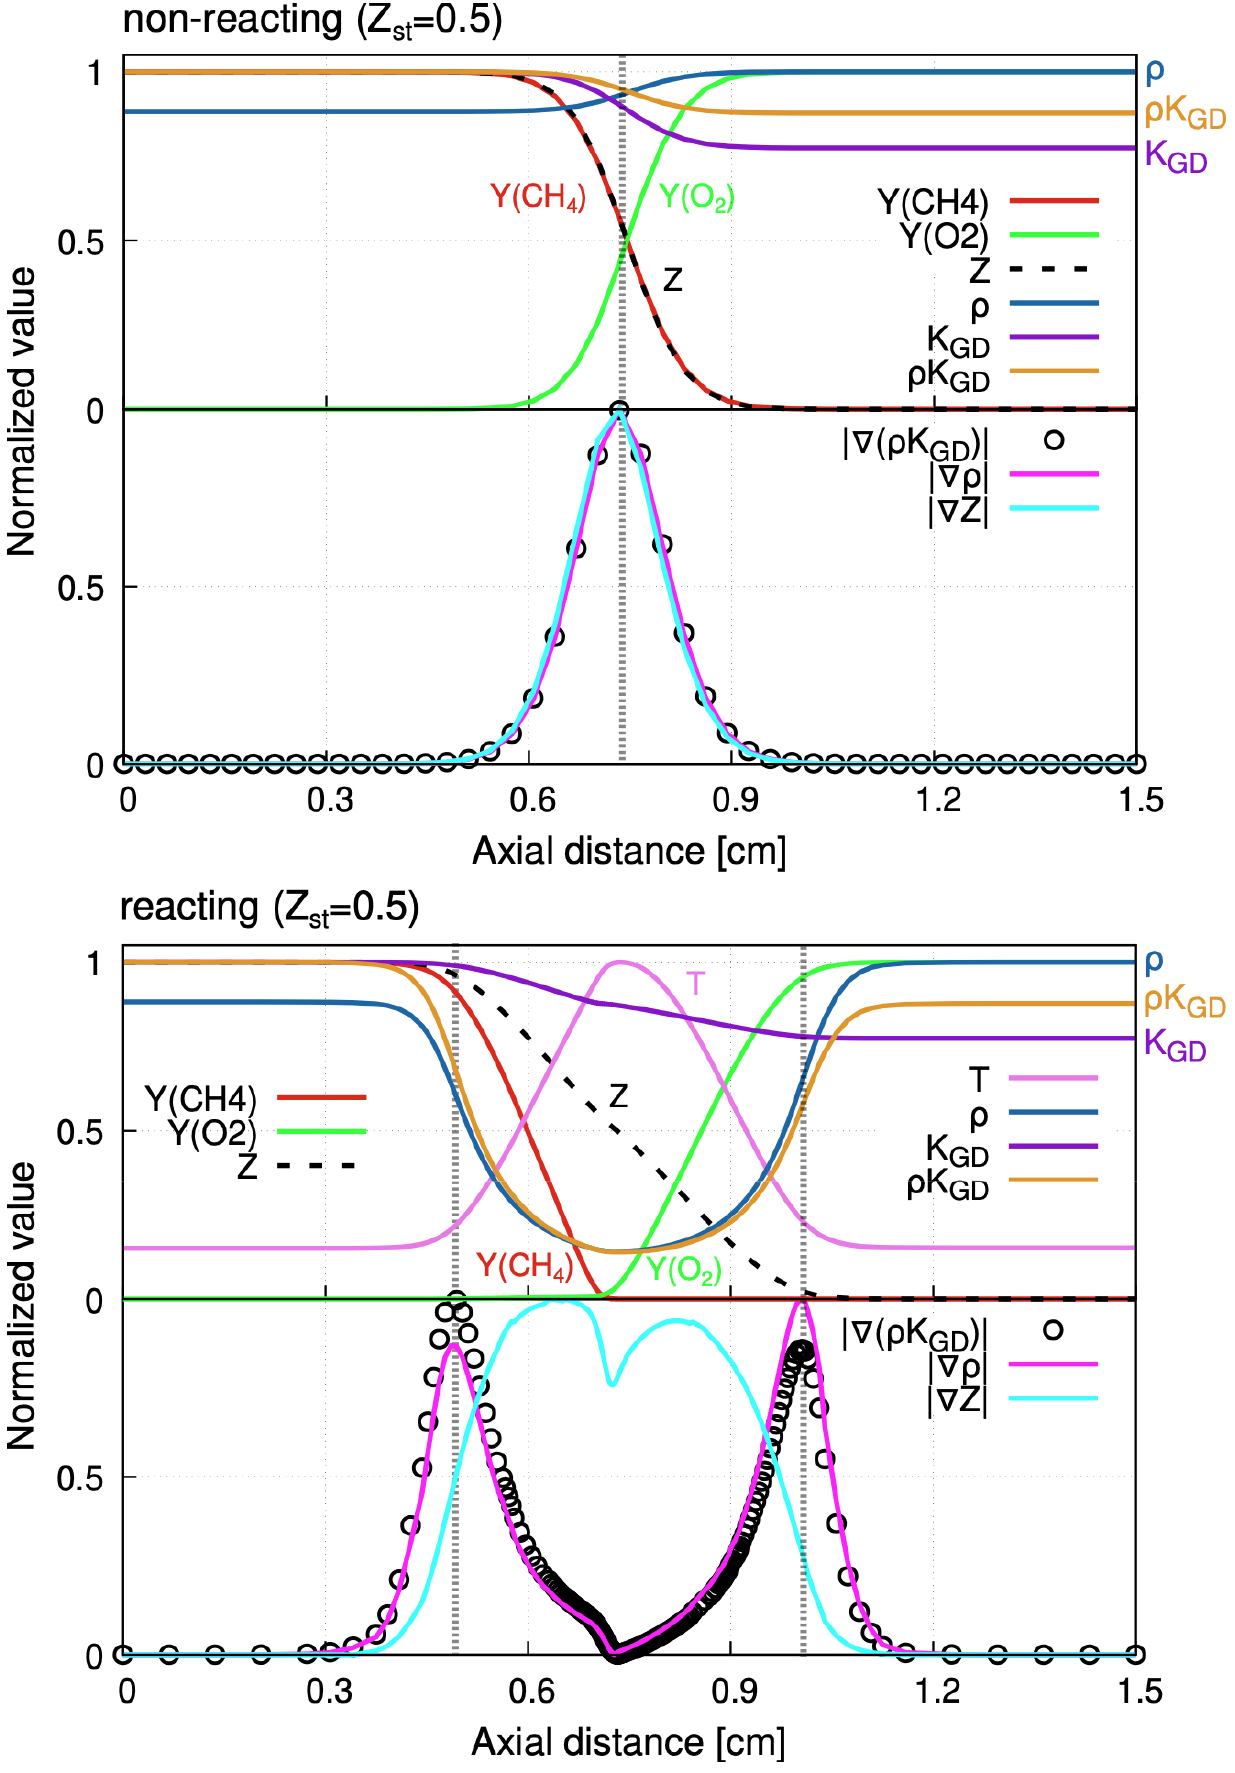
To examine the relationship between the refractive index gradient and the mixing and heating characteristics of the fuel and oxidizer, the one-dimensional solution at a stoichiometric mixture fraction of 0.5 and a nozzle spacing of 1.5 cm is presented in Fig. 6. All quantities are normalized. In the non-reacting case, methane and oxygen streams approach each other, establishing concentration gradients across the mixing layer. The mixing process is governed by the balance between convective transport and molecular diffusion. Within the mixing layer, both density and exhibit monotonic variations. The gradients of refractive index, density, and mixture fraction (Bilger formulation) collapse onto the same curve. This indicates that, in the absence of reaction, density and refractive index variations are solely governed by mixing. In the reacting case, methane and oxygen react and are consumed to form products. Heat release induces thermal expansion, leading to a deep decrease in density and subsequent heat transfer into the surrounding region. The decrease in density precedes that of mixture fraction. The refractive index gradient closely follows the density gradient rather than that of the mixture fraction. Accordingly, these density gradient peaks indicate the onset of thermal expansion, and the region enclosed between them can serve as a practical measure of flame thickness. The region between the two peaks of the refractive index/density gradient corresponds to the zone where significant variations in methane and oxygen occur, accompanied by a finite mixture fraction gradient, encompassing both mixing and reaction.
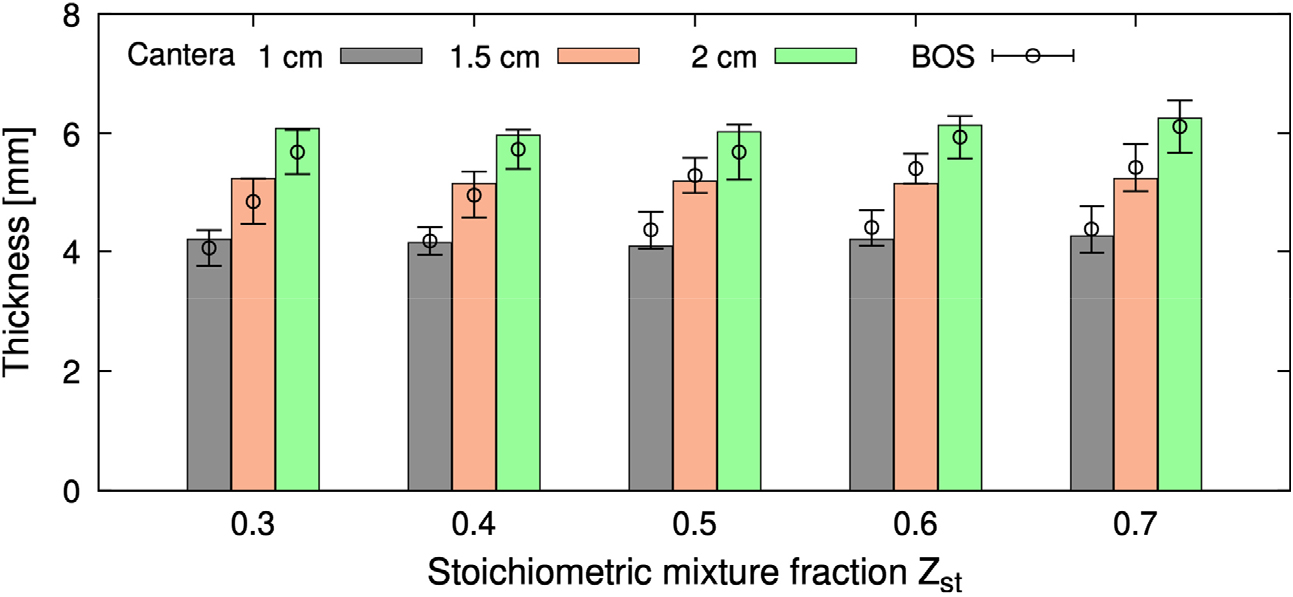
The BOS results are compared with the corresponding one-dimensional solution to assess its applicability to combustion diagnostics. Fig. 7 shows the distance between the refractive index peaks obtained from the Abel inversion BOS results and the corresponding one-dimensional solution under identical conditions. The bars represent the results by numerical solutions, while the symbols with error bars denote the BOS measurements. Each value is obtained from 1000 images acquired over 5 seconds, and the error bars include both twice the standard deviation (±2𝜎) and the measurement uncertainty associated with the spatial resolution and perspective error. For a given stoichiometric mixture fraction, decreasing the nozzle spacing leads to a decrease in the peak-to-peak distance, as observed in both the numerical and BOS results. This trend is attributed to strain rate effects. As the nozzle spacing decreases, the velocity gradient increases, resulting in a reduced extent of the mixing and reaction zones. In contrast, the mixture fraction is a less sensitive parameter for the thickness, as its effect on the strain rate is relatively minor. The BOS results show consistent and reasonable agreement with the numerical results across a range of mixture fractions and nozzle spacings that affect the strain rate.
3.3 Potential applications of BOS in non-premixed flames
A key feature of BOS is that it not only visualizes the refractive index gradient but also enables its quantitative evaluation, with estimation of density and temperature fields to be addressed in future work. Accurate quantitative reconstruction requires refractive index gradient fields with sufficient spatial resolution, an appropriate background-pattern scale for resolving the relevant physics, low noise levels, and, in particular, removal of LOS effects. Although the present counterflow flame is axisymmetric along the nozzle centerline, the buoyant plume can become asymmetric due to interaction with the upper burner wall and buoyancy-induced instability. This leads to inaccurate reconstruction, demonstrating the limitations of the single-camera measurement in the present configuration, particularly near the upper nozzle. For non-axisymmetric configurations, multi-camera measurements are required for reliable reconstruction and complete removal of LOS effects.
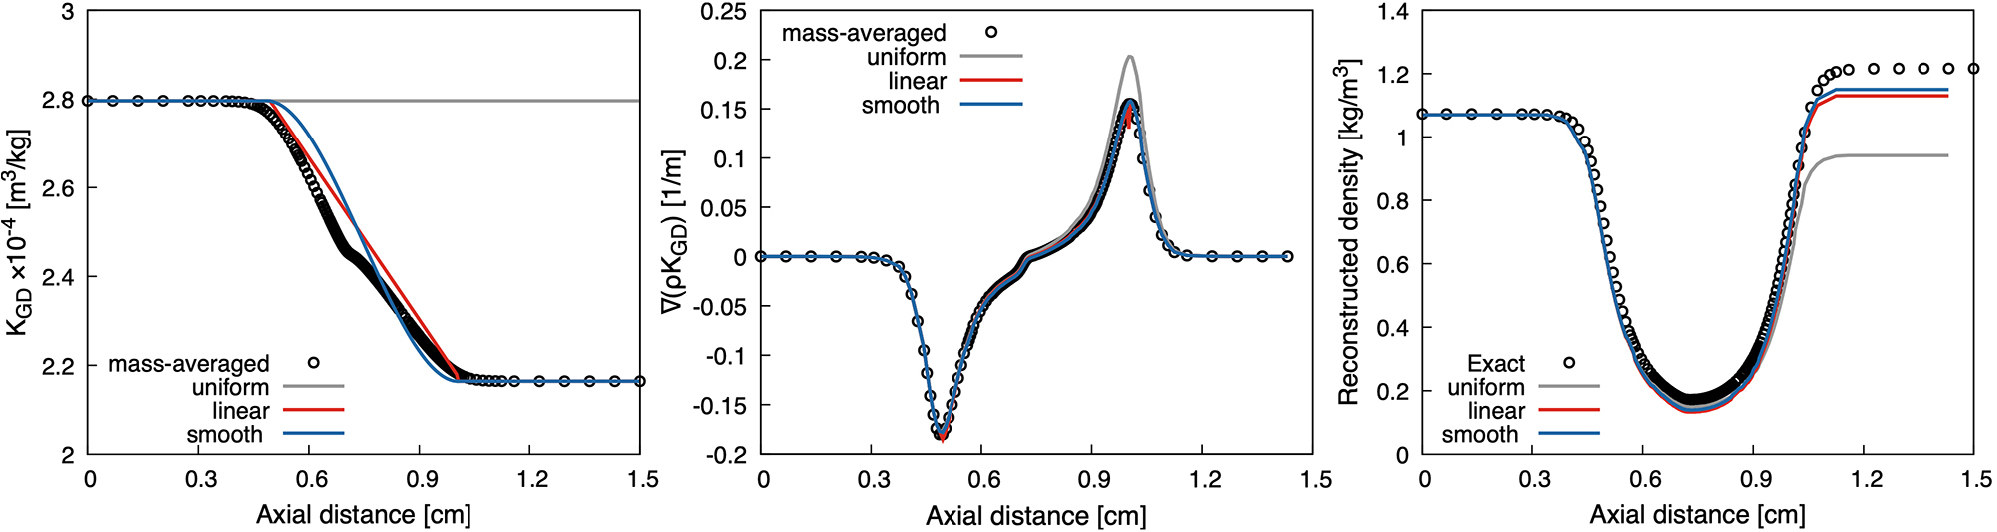
In non-premixed configurations, spatially non-uniform composition fields should also be considered, requiring appropriate modeling of the Gladstone-Dale coefficient. For example, in the reacting case shown in Fig. 5, the Gladstone-Dale coefficient remains constant prior to mixing and can be approximated within the mixing region using simple linear or smooth step functions, such as sigmoid type functions. Fig. 8 presents a sensitivity analysis of Gladstone-Dale coefficient modeling in a one-dimensional counterflow diffusion flame for refractive index calculation and density reconstruction. Three simplified models of were considered: a uniform value, a piecewise-linear model with uniform values outside the refractive index gradient peaks and linear variation inside, and a smooth cubic smoothstep-function () model. These models approximately represent the variation of within the flame region. Comparison of obtained from the one-dimensional solution showed that all models reasonably predict the peak locations, whereas the uniform model produced relatively inaccurate peak magnitudes. In the linear model, discontinuities in the gradient caused overshoots near the peak locations. Density reconstruction from given (Integration starts at =0) further showed that the uniform model accumulated the largest error, while the linear and smoothstep models provided relatively improved predictions. Although the density discrepancy can be corrected in practical reconstruction when boundary values are known, appropriate modeling can improve the ground-floor accuracy of the reconstruction. A recent study demonstrated the integration of BOS with PINNs (Physics-Informed Neural Networks) for flow fields () reconstruction [10], suggesting that its diagnostic applicability can be further extended with appropriate modeling. Such a strategy can also be applicable to modeling in non-premixed configurations and can be used for density and temperature reconstruction.
In addition to flow field reconstruction through quantitative reconstruction, quantification of density gradients can provide information on thermally affected regions alongside conventional flame front tracking, potentially enabling tracking of fuel decomposition and soot formation prior to complete oxidation in the reaction zone. As shown in Fig. 3(d), strong refractive index gradient are obtained around the contour of the visible flame where intense reaction occurs, providing additional information for understanding flame structure. Furthermore, compatibility with high-speed imaging can facilitate investigation of unsteady flames and extinction behavior.
4. Conclusion
In this study, BOS (Background-Oriented Schlieren) was applied to a counterflow diffusion flame to investigate refractive index gradients associated with mixing and heat release. The displacement field extracted using the Fourier transform-based demodulation method was successfully converted into refractive index gradients, and inverse Abel transformation enabled reconstruction of the radial distribution under the assumption of axis-symmetry. The Abel inversion results showed good agreement with one-dimensional numerical solutions in terms of both profile shape and peak location.
The relationship between the refractive index gradient and flame structure indicates that, in the non-reacting case, the gradients of density, mixture fraction, and refractive index are governed by mixing, whereas in the reacting case the refractive index gradient is dominated by density variations induced by heat release and mixing, forming a characteristic double-peak structure. The peak-to-peak distance obtained from BOS is in good agreement with the strain-rate-dependent variation, demonstrating its capability to capture flame structure and thickness.
