

1. Introduction
2. Experiments and Models
2.1 Experimental setup and conditions
2.2 Machine learning model
3. Results and Discussion
4. Conclusions
1. Introduction
The precise control of fuel injection is a key enabler for meeting future demands on combustion efficiency, emission reduction, and fuel economy in internal combustion engines (ICEs). Modern common-rail injection systems operate at increasingly high pressures and implement sophisticated injection strategies, such as multiple and short-pulse actuation. These strategies enhance atomization and combustion performance [1,2,3], but under such conditions, fuel injection becomes highly nonlinear and sensitive to parameters like injection pressure, chamber conditions, and energizing time [4,5]. In particular, during short-duration injections, small changes in energizing time can lead to disproportionately large variations in injected mass due to the transient behavior of the solenoid actuator and internal nozzle flow hysteresis [4,5].
The rate of injection (ROI) is one of the key parameters, as it governs fuel delivery timing and influences combustion, mixing, and emission formation [6,7]. However, due to the transient and nonlinear nature of injector dynamics, especially in short-pulse events, accurate characterization of ROI remains challenging [4,8]. Injection behavior can be affected by factors such as pressure, energizing duration, and nozzle geometry [9,10,11]. To overcome these challenges, recent studies have combined experimental measurements with computational fluid dynamics (CFD) simulations [12], and more recently, with machine learning (ML) approaches to improve predictive accuracy and reduce computational cost. Injection strategies such as multiple or split injections continue to be studied for their effects on combustion efficiency and emissions [13,14,15,16,17,18], while standardized injector hardware and operating conditions provided by the Engine Combustion Network (ECN) support reproducibility and cross-laboratory comparison [5,13,19,20,21,22,23,24,25,26,27,28,29,30,31]. To fully leverage such modeling and data-driven tools, accurate measurements of injected quantities and detailed understanding of injection behavior under various operating conditions remain essential.
Among the ECN injectors, Spray C is a widely studied single-hole diesel injector with a 0.2 mm cylindrical orifice (K-factor = 0), designed to induce internal cavitation with minimal erosion [32]. Its geometric simplicity and repeatability make it ideal for benchmark studies across experimental and modeling domains. Extensive research has examined Spray C behavior under different conditions using optical diagnostics and hydraulic measurement techniques. For instance, Kastengren et al. [10] utilized advanced X-ray diagnostics to investigate the onset and development of cavitation inside the Spray C nozzle, contributing critical insights into internal flow visualization. Similarly, Pickett et al. [8] and Payri et al. [33] used high-speed imaging and ROI measurements to analyze the transient characteristics of the injection process and their relationship with needle lift and cavitation behavior. These studies have emphasized that injector-specific characteristics such as manufacturing tolerance, actuation delay, and nozzle geometry can significantly affect the injection dynamics. Beyond automotive engine studies, the knowledge gained from Spray C has direct implications for propulsion and energy systems, where high-pressure injection strongly influences combustion stability, thermal efficiency, and emission reduction [8,32]. The standardized and reproducible features of Spray C make it a valuable platform for developing predictive tools and design strategies applicable to advanced gas turbines, aerospace propulsion devices, and next-generation energy conversion technologies.
Although CFD and one-dimensional (1D) hydraulic models have been used to simulate injector flow and ROI profiles, these approaches often require detailed geometric and flow property inputs and can be computationally demanding [34]. To address these issues, ML has attracted significant attention as a data-driven modeling tool capable of accurate predictions without requiring explicit representations of internal flow physics. Artificial neural networks (ANNs), in particular, have shown promise in modeling complex, nonlinear systems such as fuel injectors. By training ANN on experimental ROI data across varying conditions, such as injection pressure, chamber pressure, chamber temperature, and energizing time, accurate prediction of the injection profile becomes feasible. Previous studies have demonstrated that ANNs can replicate not only the overall trend of ROI curves, but also critical features such as hydraulic delay, overshoot, and oscillations [35].
Our recent work by Choi et al. [36] investigated the injection behavior of the ECN Spray A-3 piezoelectric injector under varied operating conditions using both experiments and machine learning techniques. A Bayesian-regularized ANN was trained on measured ROI data [5], successfully predicting transient and quasi-steady ROI profiles. The model accurately reproduced features such as initial negative ROI, hydraulic delay, and oscillatory behavior, while achieving R2 values exceeding 0.99. Compared to conventional CFD or 1D hydraulic models, this ML-based method offers a computationally efficient means of generating realistic ROI curves without detailed injector geometry. To evaluate the generalizability of this approach, it is necessary to evaluate the ANN-based prediction framework on other types of injectors beyond Spray A-3.
In this study, the fuel injection characteristics of the ECN Spray C injector were experimentally investigated under a range of operating conditions, such as injection pressure, chamber pressure, temperature, and energizing time. Building upon the ML framework previously applied to the Spray A-3 injector, the same modeling approach was extended to the solenoid-driven Spray C injector to assess its applicability across different injector types. The ANN model accurately captured both transient and quasi-steady ROI profiles, even under cavitation-prone conditions and short energizing durations. The model’s predictive performance demonstrates its ability to reflect nonlinear injection dynamics without relying on complex physical models.
2. Experiments and Models
2.1 Experimental setup and conditions
2.1.1 Spray C injector
The Spray C injector, designated by the ECN, is a diesel injector equipped with a single-hole cylindrical nozzle featuring a 0.2 mm orifice diameter and a K-factor of 0 [32]. The nozzle was purposefully designed to induce internal cavitation while limiting material erosion. It features a cylindrical orifice with approximately 5% hydro-erosion and a mini-sac volume of 0.65 mm3. High-resolution X-ray computed tomography (CT) imaging was performed to visualize the internal geometry and assess potential cavitation regions [32]. As shown in Fig. 1, the three-dimensional (3D) reconstruction and corresponding axial density profiles clearly reveal the sharp-edged cylindrical orifice and mini-sac structure. The observed spatial density gradients along the nozzle axis suggest localized regions where cavitation is likely to form, influencing transient injection behavior and flow-induced oscillations during the opening phase. Owing to its well-defined geometry, strong cavitation tendency, and compatibility with both optical and hydraulic diagnostics, Spray C serves as a widely adopted platform for injector benchmarking, ROI measurements, and data-driven modeling within the ECN community [37].
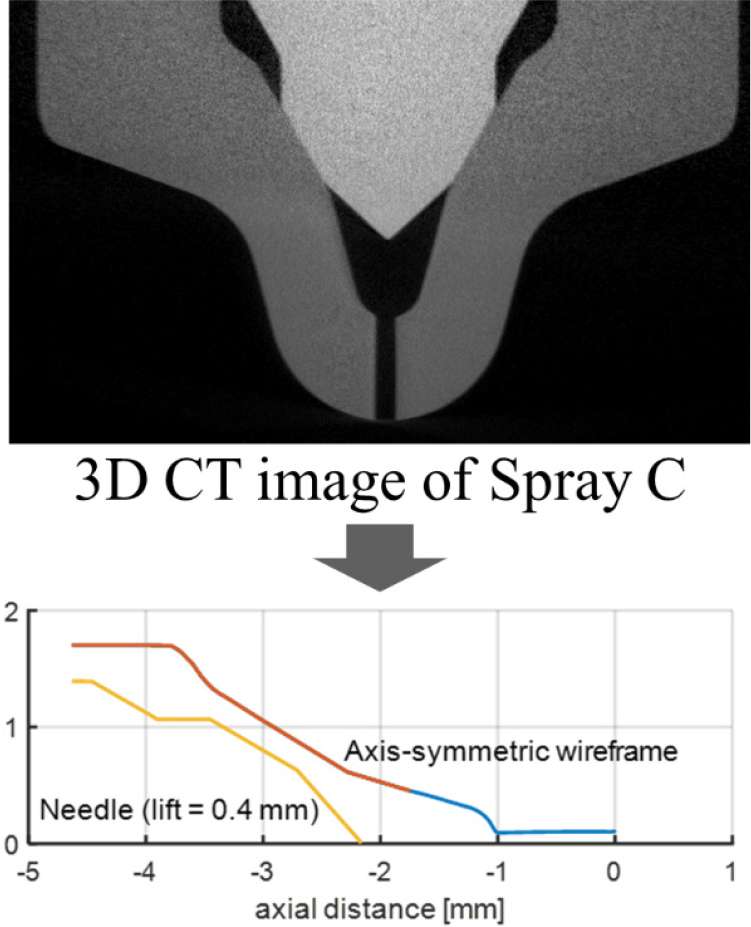
Fig. 1.
High-resolution X-ray CT visualization of the Spray C nozzle: (top) reconstructed cross-sectional geometry; (bottom) normalized axial density profiles indicating cavitation-prone regions along the orifice. Fig. 1 is reproduced from [32] with permission.
2.1.2 Moehwald Hydraulic Discharge Analyzer (HDA)
Injection rate measurements for the ECN Spray C injector were performed using a HDA, as illustrated in Fig. 2. The HDA is a fluid-filled closed-chamber system that determines the injection rate and total injected mass by measuring transient pressure variations induced by the injection event [38]. The system calculates the ROI based on the time-resolved chamber pressure and the speed of sound in the fluid, which is derived from pressure wave propagation and reflection inside the chamber. A piezoresistive pressure sensor was installed on the chamber wall to monitor pressure fluctuations, and a piezoelectric ceramic element positioned at the base of the chamber generated acoustic pulses to determine the speed of sound [5]. Fuel was supplied to the injector using a high-pressure syringe pump filled with iso-dodecane, maintaining a nearly constant pressure at the injector inlet.
For Spray C, the injector was actuated by a solenoid driver (Genotec), and the electrical energizing pulse was synchronized with the HDA system via a delay generator. Real-time voltage and current signals were recorded to assess the dynamic response of the solenoid actuator. Table 1 summarizes the test conditions, including injection pressures of 500-1500 bar, chamber pressures of 20-60 bar, and chamber temperatures of 70 and 90 °C. The applied energizing time was 4.45 ms, representing the duration of electrical actuation to the injector. These test conditions were designed to evaluate the transient and quasi-steady injection behavior under diverse thermodynamic and actuation scenarios. Further details on the HDA measurement methodology can be found in previous literature [5]. All measurement uncertainties were quantified using the Student’s t-distribution, assuming a 95% confidence interval. The maximum measurement uncertainty is observed to be 0.23% (± 0.019 g/s) with a 95% confidence level.
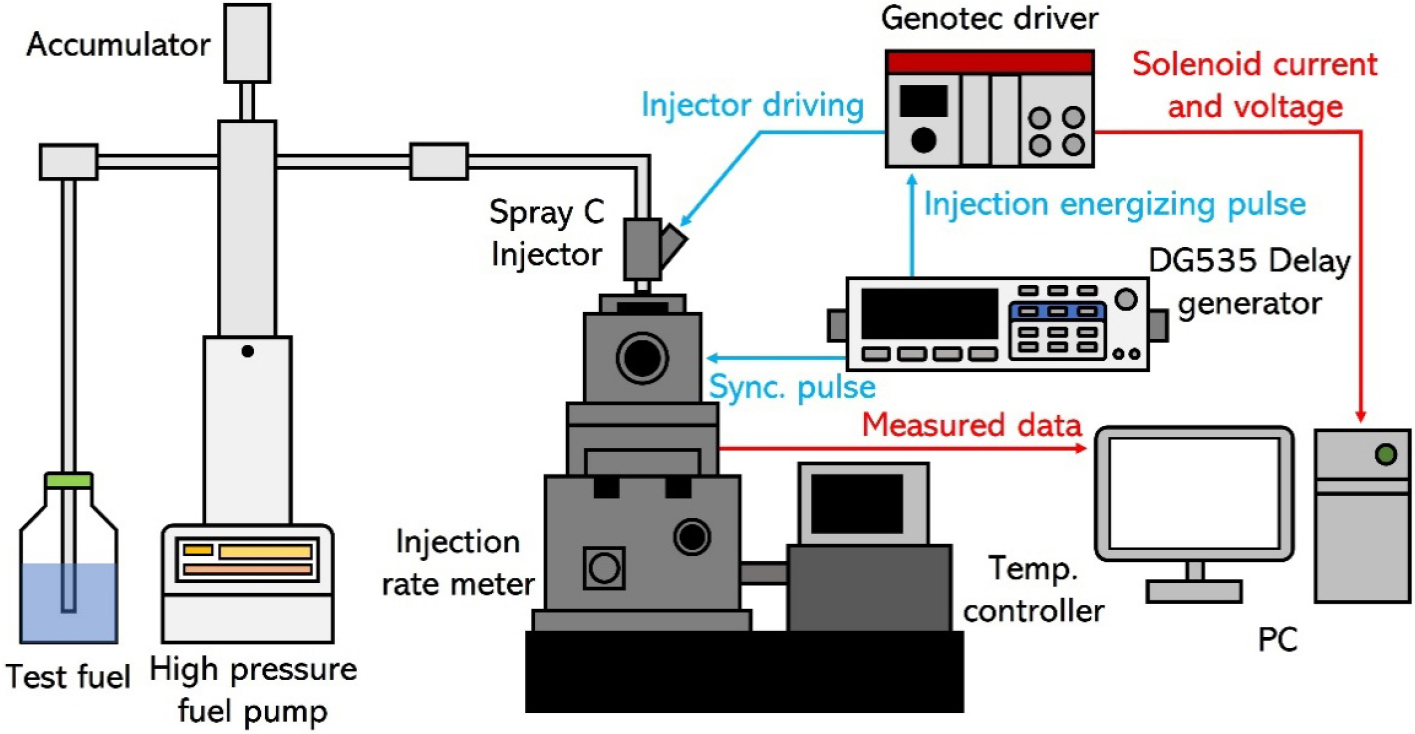
Table 1.
Experimental conditions for Spray C injector.
| Parameter | Values |
| Fuel | iso-dodecane |
| Injection pressure (Pinj, bar) | 500, 1000, 1500 |
| Chamber pressure (Pc, bar) | 20, 40, 60 |
| Chamber temperature (T, °C) | 70, 90 |
| Energizing time (ET, ms) | 4.45 |
2.2 Machine learning model
In this study, a Bayesian regularization algorithm, which belongs to the class of ANN, was employed to analyze the data and predict the ROI. This algorithm provides enhanced robustness compared to standard backpropagation, reducing the need for extensive cross-validation. Due to its stability and generalization capability, it is commonly applied in various engineering problems. The ANN architecture consists of layers composed of neurons, which serve as the fundamental processing units [35,39,40]. ROI is known to depend on chamber pressure (Pc), energizing time (ET), chamber temperature (T), and injection pressure (Pinj), as expressed in the following equation:
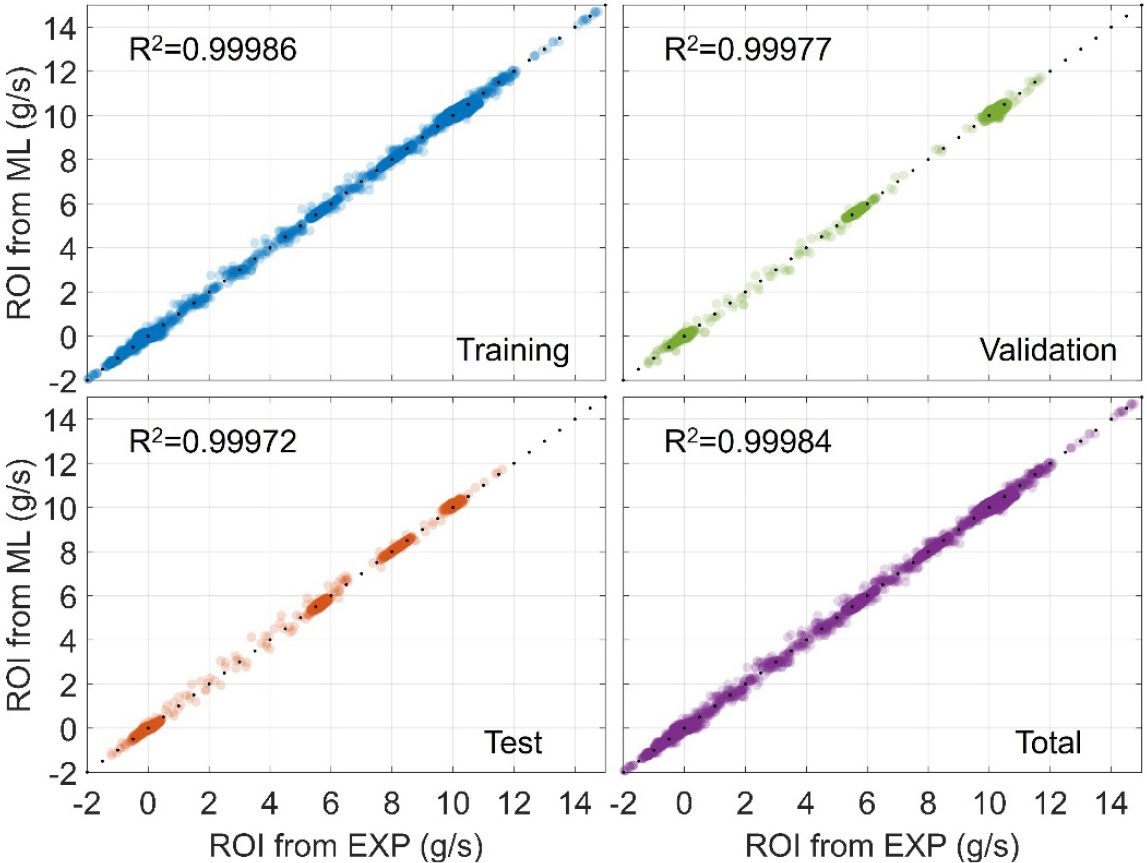
ROI predictions were carried out using MATLAB’s built-in ANN tool. The model was trained on measured ROI data using the four input parameters. The number of epochs was set to 500 as the model had already converged within this range. The ANN architecture included two hidden layers: the first with 23 neurons and the second with 10 neurons. The output layer produced the predicted ROI. Before employing the ANN, a training process was conducted in which the weights and biases of neurons were optimized to minimize the prediction error for the given dataset. During this process, various dataset split ratios for training, validation, and testing were explored, and the best ROI performance was obtained with a ratio of 80% training, 10% validation, and 10% testing. This configuration was therefore adopted in the present study to ensure robust model generalization. Model validation was then conducted by evaluating the correlation between the ANN predictions and the corresponding experimental measurements. The coefficient of determination (R2) values for the training, validation, and test datasets all exceeded 0.99, indicating excellent regression performance and the model’s suitability for predicting the ROI, rather than merely overfitting the data. As shown in Fig. 3, the ANN predictions for the Spray C injector exhibited strong agreement with the experimental measurements across all datasets. Here, the y-axis represents the ROI predicted by the ANN, while the x-axis denotes the ROI obtained from the experiments. The model’s robustness was further validated using input conditions excluded from the training, validation, and testing procedures, confirming its generalization capability beyond the training set.
3. Results and Discussion
Fig. 4 illustrates the temporal profiles of the ensemble-averaged ROI and injection energizing signal for an energizing time of 4.45 ms. The test was conducted under an injection pressure of 1500 bar, a chamber pressure of 60 bar, and a chamber temperature of 70 °C. The solid line represents the mean ROI, while the shaded region indicates the standard error of the mean with a 95% confidence level. A distinct hydraulic delay is observed between the electrical energizing and the actual start of injection (SOI), with the ROI signal beginning to rise at approximately 1.86 ms. The ROI rapidly increases to nearly 12 g/s and enters a quasi-steady phase, fluctuating around 10.15 g/s. Injection terminates at around 8.5 ms (EOI), where the ROI drops sharply to zero. A secondary peak is observed after the end of injection, which may be attributed to injector rebound or cavitation-induced effects. In Fig. 4, key injection parameters are marked, including the energizing signal duration, the injection duration based on the 20% threshold method, and the quasi-steady region.
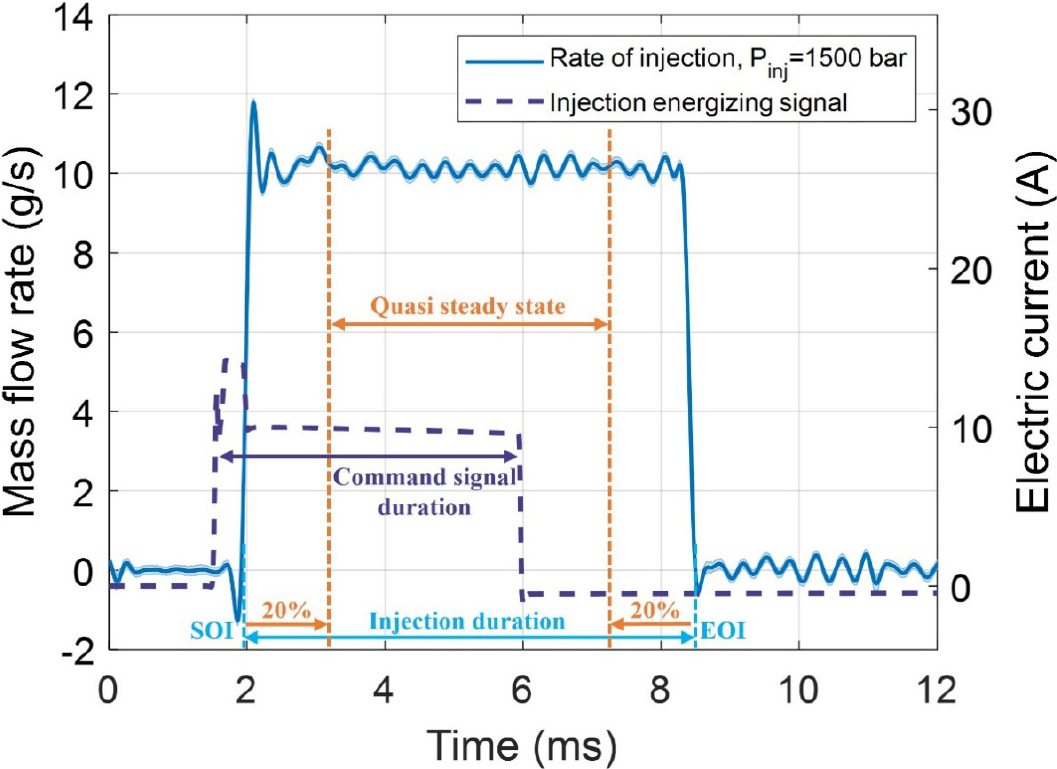
Fig. 5 presents a comparison of injection rate profiles under various chamber pressures and temperatures at a fixed injection pressure of 1500 bar. The results indicate that chamber temperature (Tc) has a negligible influence on the overall injection behavior, with nearly overlapping curves for 70 °C and 90 °C at each chamber pressure level. In contrast, chamber pressure (Pc) affects the initial peak in the injection rate. Higher chamber pressures lead to a noticeable reduction in the peak mass flow rate during the early injection phase. This attenuation effect is more distinct than what was previously observed in the piezoelectric Spray A-3 injector. While an increase in chamber pressure slightly lowers the quasi-steady injection rate, the reduction is minor and does not significantly alter the overall injection duration or profile shape.
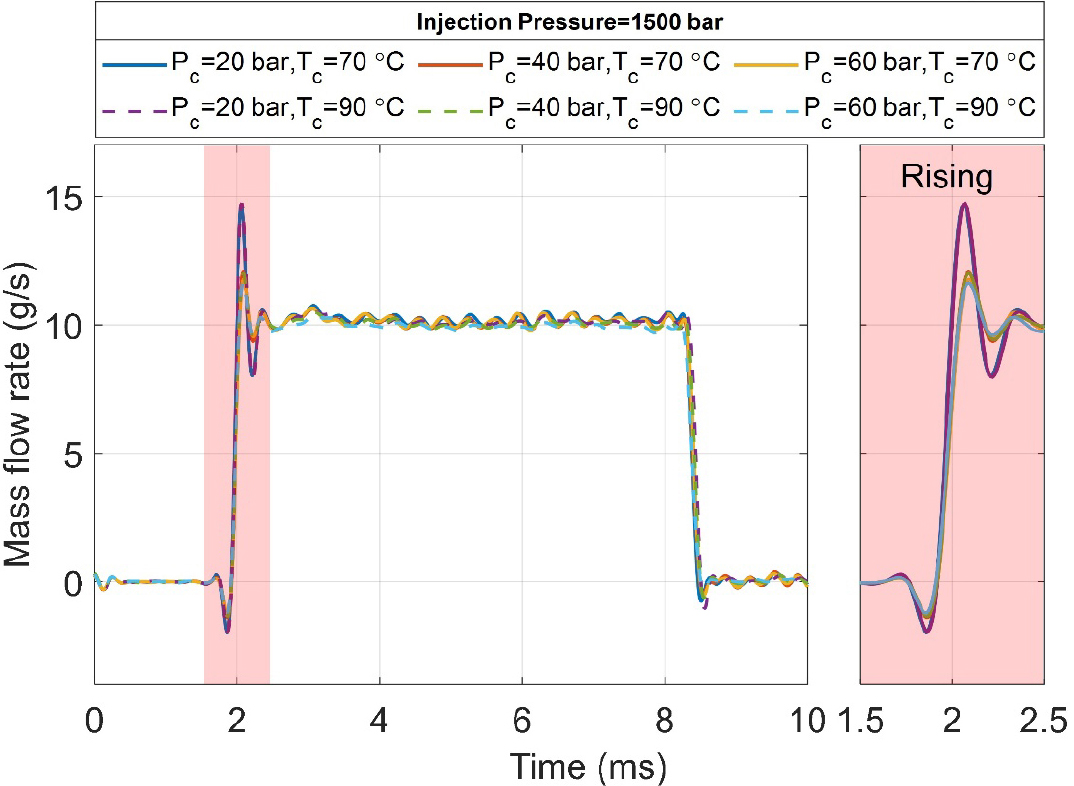
Fig. 6 shows the ensemble-averaged injection rate profiles along with standard deviation bands obtained from repeated measurements at three different injection pressures: 500, 1000, and 1500 bar. All tests were conducted under fixed chamber conditions of 60 bar and 70 °C. As expected, the quasi-steady mass flow rate increases with higher injection pressures, reflecting the enhanced pressure-driven fuel delivery. Compared to the Spray A-3 injector, the Spray C injector demonstrates a more linear relationship between injection pressure and mass flow rate, accompanied by notably consistent injection durations across different pressures. At higher injection pressures, a sharper initial drop followed by a stronger overshoot is observed, which is attributed to the greater pressure differential between the injector and chamber. This behavior is also accompanied by intensified oscillations during the early injection phase, indicating increased flow instability under elevated pressure conditions. Overall, these results emphasize the predictable and pressure-sensitive performance of the Spray C injector, particularly in its transient and quasi-steady injection behaviors.
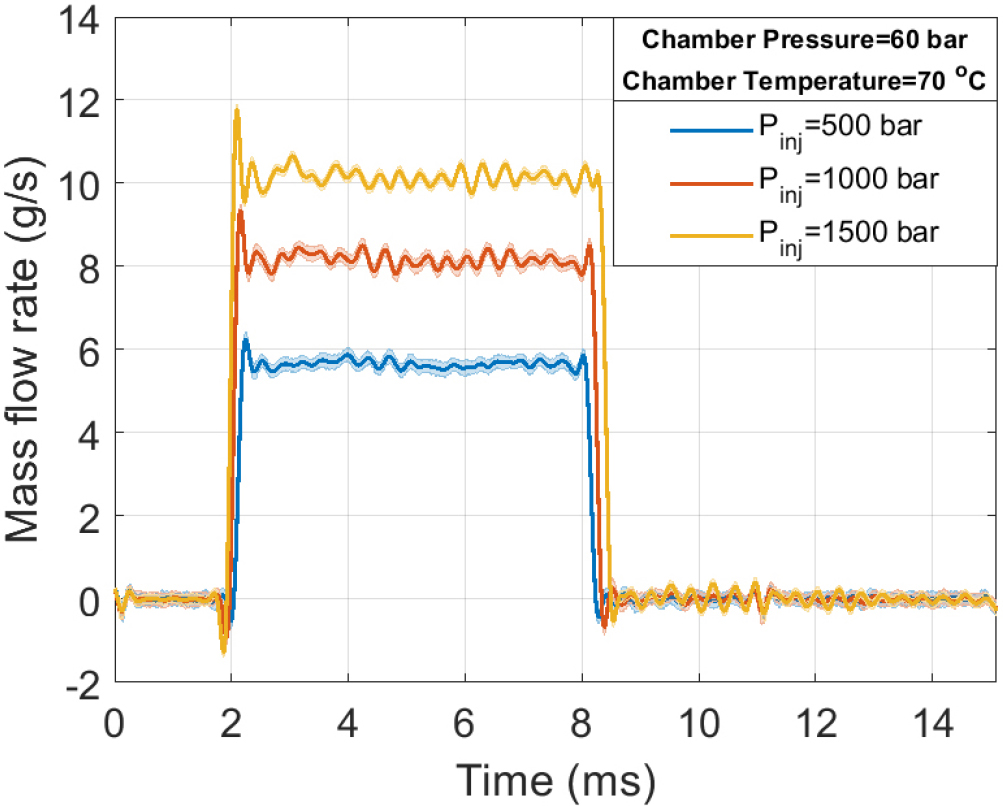
Fig. 7 describes the temporal profiles of ROI obtained from both experiments and ML-based predictions for various injection pressures, with chamber conditions fixed at 60 bar and 70 °C, and an energizing time of 4.45 ms. The ML-predicted cases include intermediate injection pressures of 750 bar and 1250 bar, for which no experimental data were acquired. The ML results closely follow the experimental trends, capturing both the quasi-steady ROI and transient features with good accuracy. Furthermore, both the overshoot and initial oscillations in the ROI diminish at lower injection pressures, indicating a reduction in inertial and cavitation effects. These trends are even more pronounced in the raw experimental signals. Conversely, the hydraulic injection duration becomes slightly longer at higher injection pressures, consistent with increased momentum and flow rate. To further evaluate the influence of energizing time, injected mass measurements were conducted at three injection pressures, the results of which are not included in this paper. At an energizing time of 2.1 ms, the injected masses were approximately 23 mg, 35 mg, and 47 mg, respectively. When the energizing time was increased to 4.0 ms, the injected masses rose to approximately 35 mg, 51 mg, and 66 mg. These results confirm a near-linear relationship between injected mass and energizing time, with a steeper rate of increase observed at higher injection pressures, reflecting a stronger flow-driving force. This affirms that energizing time and injection pressure are the dominant parameters governing injection quantity in solenoid-type injectors such as Spray C.
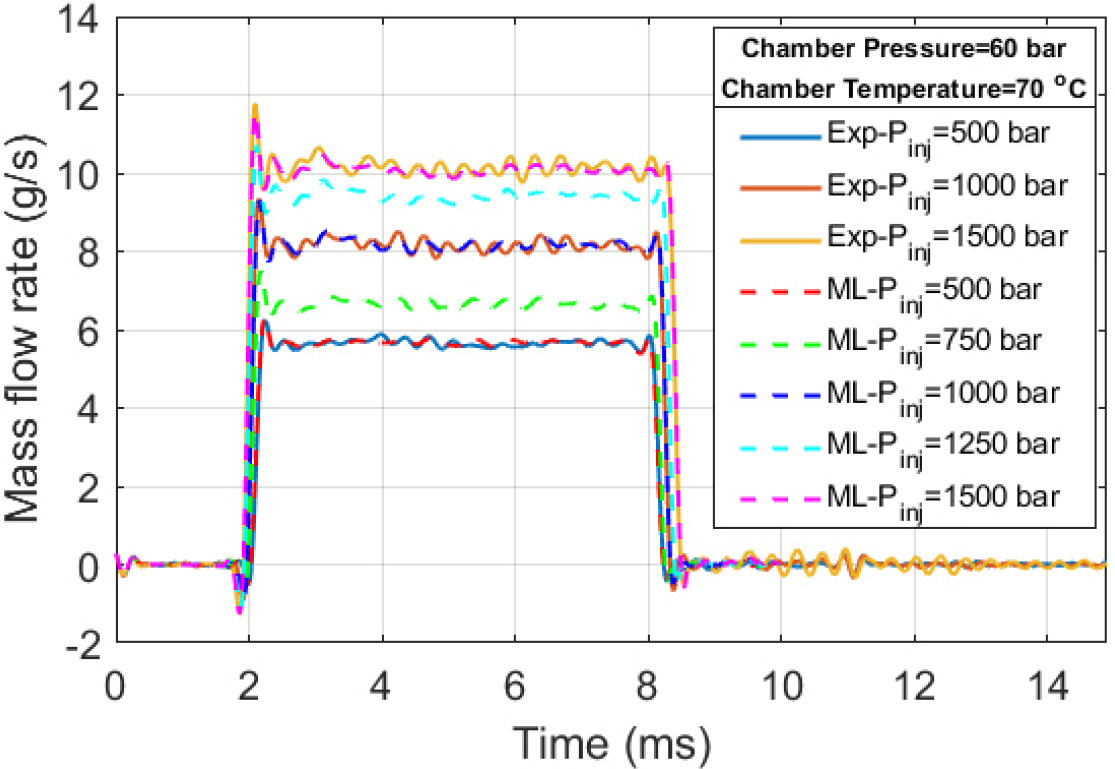
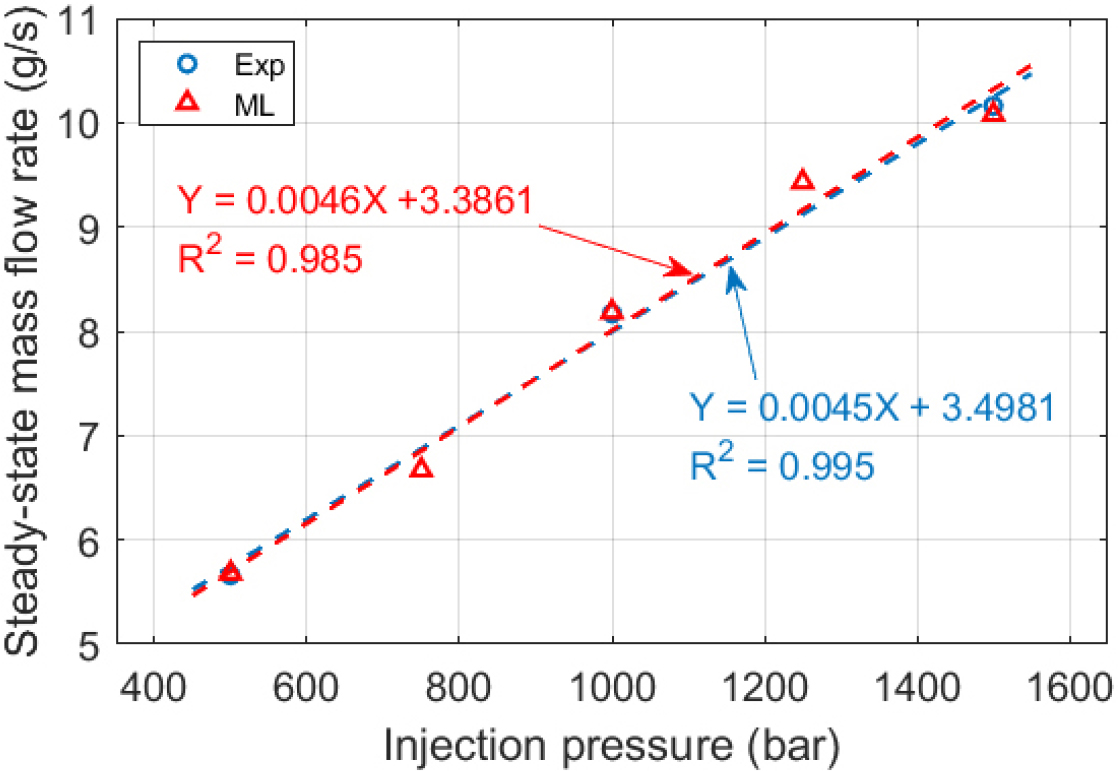
Fig. 8 illustrates the relationship between injection pressure and the steady-state mass flow rate. In this study, the steady-state period is defined as the interval between 20% after the start of injection and 20% before the end of injection. Here, the 20% refers to the time fraction of the total injection duration (SOI-EOI), as also illustrated in Fig. 4. The experimental data exhibit a nearly linear trend, while the ML-based predictions show a slight deviation toward nonlinearity. Nonetheless, linear least-squares regression applied to both datasets yields high coefficients of determination: R2 = 0.995 for the experimental data and R2 = 0.985 for the ML predictions. These results confirm a strong linear correlation, corresponding to confidence levels of 99.8% and 96.2%, respectively. The excellent agreement between the two datasets validates the capability of the ML model in predicting steady-state injection behavior across a wide pressure range. The slight deviation observed in the ML predictions, particularly at intermediate injection pressures (e.g., 750-1250 bar), may stem from relatively sparse training data in those regions, suggesting potential benefits from further dataset enrichment. In addition, the observed linearity reflects that, under constant chamber conditions, injection pressure is the dominant factor governing the quasi-steady mass flow rate, which is consistent with orifice flow theory. These results also demonstrate the generalizability of the ML model and its potential for supporting injector design and optimization without the need for exhaustive testing.
The discharge coefficient (Cd), a dimensionless indicator of nozzle flow efficiency, is compared in Fig. 9 as a function of Reynolds number (Re) for both the Spray A-3 and Spray C injectors. In the case of Spray A-3, Cd increases monotonically with Re, consistent with previous findings [33]. This behavior reflects the flow regime transition driven by the convergent nozzle geometry and fast needle actuation, which enhances momentum transfer as injection pressure increases. In contrast, the Spray C injector exhibits relatively constant or slightly decreasing Cd values with minor fluctuations, indicating a more stabilized internal flow under varying Reynolds conditions. This difference is attributed to the cylindrical orifice design and solenoid-based actuation mechanism of the Spray C injector, which result in reduced sensitivity to pressure-driven flow changes [33,41]. Both experimental and ML-predicted results demonstrate consistent trends, with the ML model effectively capturing the overall behavior of each injector type. However, in the Spray C case, ML predictions tend to slightly underestimate Cd at certain Re. This minor deviation suggests that the model, while capable of reproducing global flow characteristics, may benefit from incorporating additional physical features such as cavitation effects, partial needle lift behavior, or transient turbulence phenomena. Despite these injector-specific flow differences, the ML model maintains high predictive accuracy across both configurations, reinforcing the generalizability and robustness of the ANN-based approach in modeling nozzle flow behavior under diverse conditions.
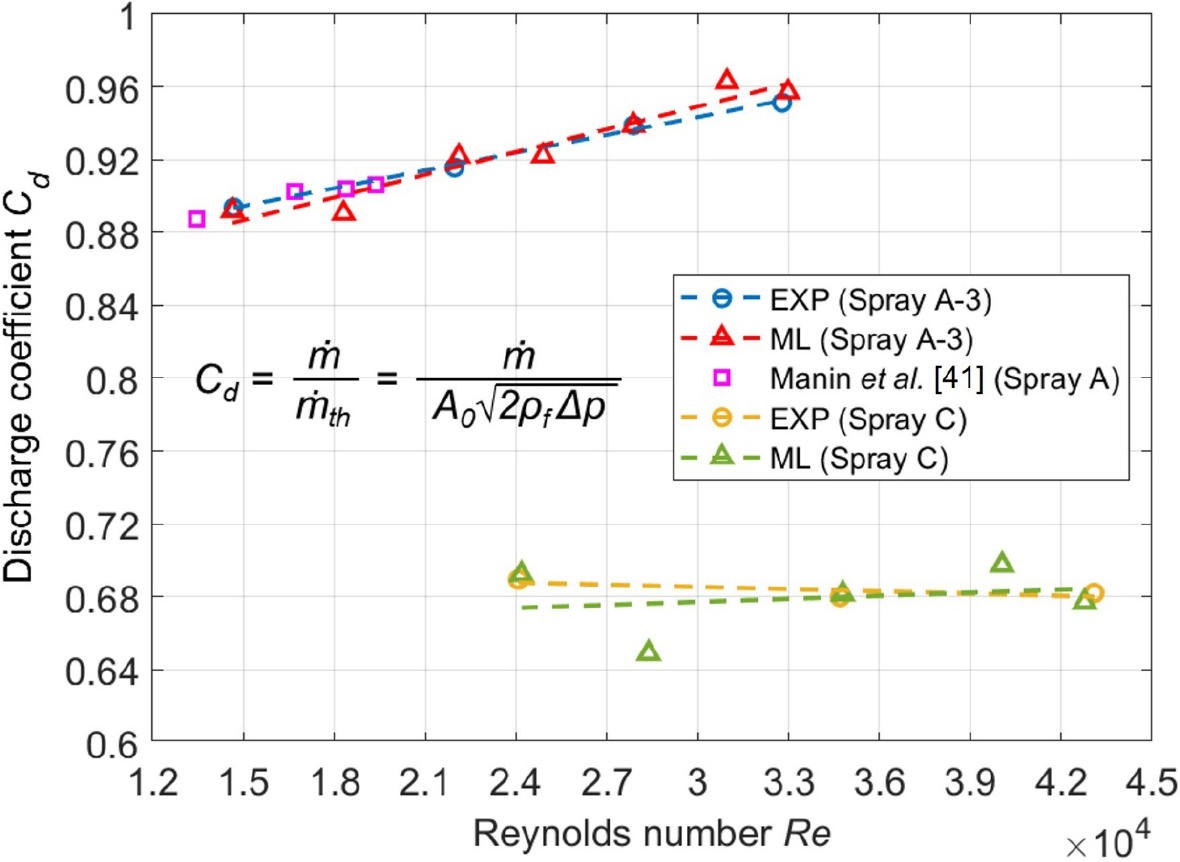
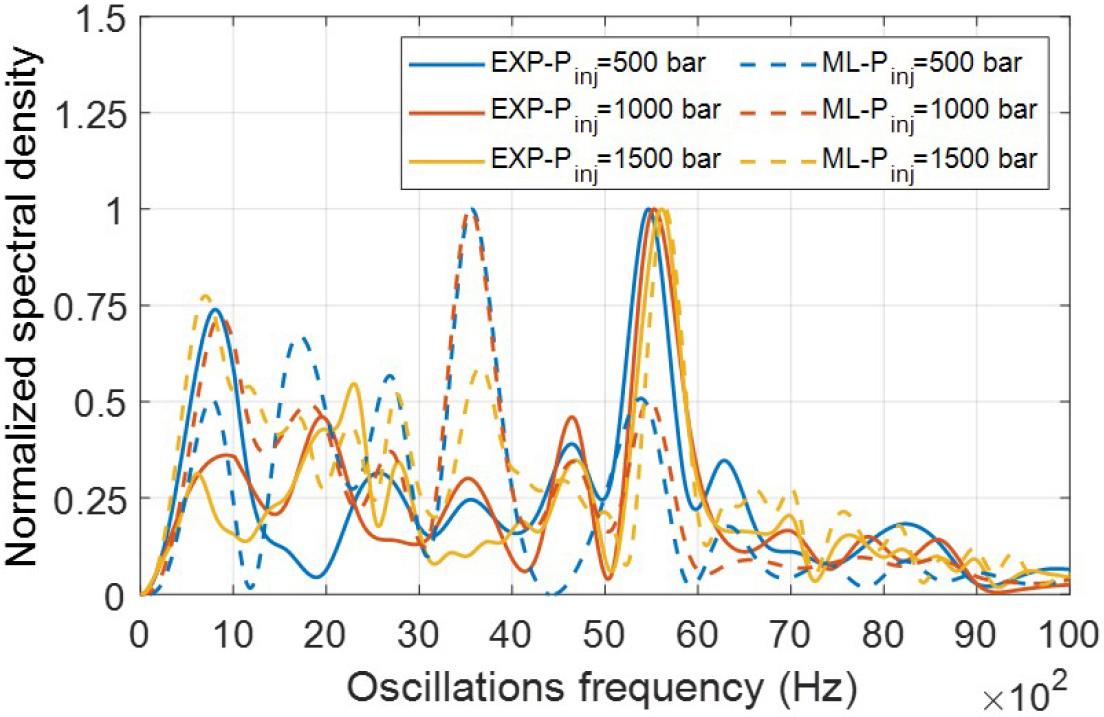
Fig. 10 presents the frequency-domain analysis of ROI signal through normalized spectral density plots for various injection pressures. The experimental signals exhibit dominant spectral peaks around 5500 Hz across all injection pressures. In contrast, the ML-predicted spectra show major peaks near 3500 Hz for the 500 bar and 1000 bar cases, while the 1500 bar case reasonably captures the dominant peak around 5500 Hz. These differences may be attributed to the limited temporal resolution of the training dataset or the ML model’s inability to fully resolve high-frequency transients. Compared to the Spray A-3 injector, the Spray C injector demonstrates broader and less sharply defined spectral features. This behavior is likely due to its simpler solenoid-driven actuation and less rigid mechanical structure, which contribute to more distributed and damped acoustic responses. Overall, the frequency-domain analysis validates that the ML model can effectively reproduce the primary oscillatory characteristics of the injection process, although further refinement may be required to capture higher-order dynamics or injector-specific resonance effects.
4. Conclusions
This study investigated the injection characteristics of the ECN Spray C diesel injector through a combination of high-fidelity experimental measurements and ANN-based modeling. Injection rate data were acquired under varying injection pressures, chamber pressures, temperatures, and energizing durations, and used to train an ANN model employing Bayesian regularization. The model achieved excellent predictive performance, with a R2 exceeding 0.99 across all tested conditions. The ROI and injected mass were found to increase nearly linearly with injection pressure, while chamber pressure and temperature had only marginal effects. Lower injection pressures resulted in reduced oscillatory behavior and longer hydraulic delays, consistent with observations from both the time-domain and frequency-domain analyses. The ANN model accurately captured these trends, including transient overshoots, quasi-steady behavior, and even dominant frequency components observed in the spectral domain. When compared with the Spray A-3 injector, the Spray C injector exhibited smoother ROI profiles and Cd response that was largely insensitive to Reynolds number, attributed to its solenoid actuation and cylindrical orifice design. These findings confirm the generalizability and robustness of the data-driven approach across injectors with different geometries and actuation mechanisms. Future work will focus on extending the predictive framework through deep learning architectures and incorporating additional physical variables, including real-time injector current profiles and cavitation indicators, to further improve model resolution and applicability.
