

1. Introduction
2. Methods
2.1 Numerical Domain
2.2 Governing Equations
2.3 Equation of State
2.4 Reaction Model
2.5 Interface Tracking
3. Results and Discussion
3.1 Reaction rate law verification
3.2 Particle reaction
3.3 Mesh independence test
3.4 Burning rates comparison
4. Conclusions
1. Introduction
Due to many known advantages of metalized energetic materials, metal particles such aluminum (Al), zirconium (Zr), boron (B), titanium (Ti), and magnesium (Mg) have been widely used in various combustion applications. Metals have high energy density compared to liquid jet fuels. For instance, JET-A has an energy density of 34.7 MJ/L, whereas 43.0 MJ/L for Mg and 137.8 MJ/L for B are noted. In addition, known advantages extend to the ease of storage and environmental friendliness when compared to hydrocarbon fuels.
However, the combustion mechanism associated with metalized energetic substances is not well understood as the compositions of these complex mixtures chemically react at length scales that span submicrons to centimeters, making it difficult to thoroughly address the underlying thermochemical and thermomechanical behaviors during the reaction process. In particular, these substances behave differently, depending on their particle size, mechanical properties, and chemical reaction characteristics. The burning process of these metalized energetic substances takes place in three distinct regions [1,2]. First is the outflow region composed of hot product gases with gasified metal oxides exposed to the air. Second is the melt layer comprised of reacting particles with oxidizers in the binder. Third layer the solid inner region kept at temperature below the melting point of the reactive compound. Sippel et al. [1] visualized the three regions of Al reaction for different particle types such as nano particle, flake, spherical particle, and coated Al using the high-speed camera imaging for explaining the thermochemical behavior. Establishing a combustion model considering all three distinct regions of solid, condensed melt, and gas phases has been considered quite challenging. Beckstead, in 1970, presented a model of combustion of a solid propellant consisting of three separate flames in the gas phase: primary premixed flame, primary diffusion flame, and final diffusion flame [3, 4]. Based on this model, the temperature according to the distance from the burning surface was calculated and the burning rate was predicted using a pressure-based empirical formula [5, 6]. In addition, research on how the calculated temperature profile and heat release are affected by the change of the kinetic parameters was also conducted [7]. In the past, the metal additives to high explosive substances such as AP, HMX, and RDX were considered, while metal alone as a potential alternative fuel has not been studied in detail [8]. A pyrotechnic mixture of Zirconium (Zr) and potassium perchlorate (KClO4) as oxidizer is considered. Han et al. simulated the particle dynamics in a closed vessel by assuming a perfectly spherical Zr particle that burns according to the pressure-based regression rate [9]. Studies are conducted based on the continuum scale while the complex particle-medium interfaces are not tracked in the mesoscale. Most of the related studies have focused on a region where the hot product gases are released in an outflow layer, making it difficult to comprehend how the entire process of thermal and mechanical responses to the reaction of metalized energetic substances take place. The work of Kim et al. is noteworthy where they presented such mesoscale simulation of the after-burning of Al particles exposed to a high-temperature environment of detonative hot product gases [10, 11]. They too have not addressed the melt layer where the critical particle interaction occurs during the chemical reaction process.
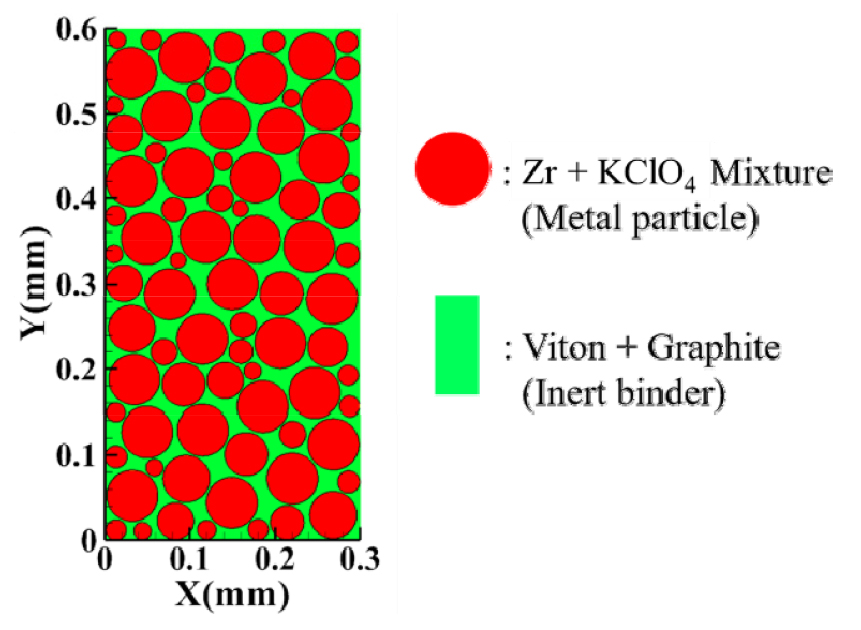
In the present work, we consider the combustion of non-homogeneous metalized energetic substance on the particle scale and simulate how metal/oxidizer particles of micron size embedded in an inert binder behave during the burning process while taking a closer look into the complex dynamics within the melt layer. Fig. 1 is a conceptual schematic illustrating the surface burning of a solid fuel that contains metal particles in a premixed fuel-oxidizer state. In particular, the melt layer, where the combustion of metal particles takes place, is the intermediate domain between the upper outflow and the lower inert regions. ZPP (52wt% Zr, 42wt% KClO4, 5 wt% Viton B, 1 wt% graphite) is used as a representative metalized substance, subjected to its surface combustion modeling. The level-set method is used to track the interface of evolving particle boundaries, and the interaction between the particle (Zr + KClO4) and binder (Viton B + graphite) is considered. The reaction rate law is constructed based on the in-house calorimetry. The resulting single-step rate law that utilizes the combustion parameters as functions of the reaction progress is implemented in the mesoscale simulation of ZPP reaction.

2. Methods
2.1 Numerical Domain
It is noted that the methodology as developed in this work is not limited to ZPP and rather applicable to any other metalized substances subjected to a mesoscale surface burning. The oxidizer, KClO4 and Zr as fuel were assumed to be a single mixture particle and treated separately from the inert binder. The initial shape of this premixed microparticle was assumed to be circular in the two-dimensional domain as illustrated in Fig. 2. The average particle diameter was set to 48 μm, which is an experimentally observed particle size. Particles with diameters of 10~60 μm are randomly generated on the entire domain from largest to smallest. Binder fills the background material without any voids, thereby defining a set of 3 elements to the present domain, namely a premixed combustible particle, inert binder, and the hot product gases. The initial temperature was set to 300 K, and 20% of the upper part in the domain was heated to 1300 K by an external heat source for initiation of the reaction. The domain of numerical simulation was set to 0.3 mm by 0.6 mm in x and y directions. The total number of uniform grids was 180,000 (300 × 600). Since the upper part of the boundary was assumed to be an outflow, a zero gradient boundary condition was applied. Periodic boundary conditions were considered on both left and right sides. Wall boundary condition was applied to the lower part as the temperature below melting is assumed in the region below the melt layer.
2.2 Governing Equations
There are two distinct interfaces that related three components in the numerical consideration of the reactive domain. A premixed reactive particle (Zr + KClO4), inert binder (Viton B + graphite), and hot reacted product in gas phase. Amongst these components that require clear material interface, the particle and binder were assumed to have zero strength as they are present in the melt layer. On the other hand, the product gases were assumed to be compliant with the Nobel-Abel equation of state. Two-dimensional compressible Euler equations are used as shown in Eqns. (1~3). and are the vectors for conservation variables, spatial fluxes in x-direction, spatial fluxes in y-direction, and source term, respectively.
Here, and are density, velocity in x and y directions, total energy, reaction progress and heat of reaction, respectively. All equations are solved by a third-order Runge–Kutta (RK) and essentially non-oscillatory (ENO) methods [12] for temporal and spatial discretizations, respectively. The code makes use of an explicit high-order RK temporal integrator with known stability. In addition, each time step is calculated with CFL number for numerical stability of convective flow as shown in Eqn (4). Time steps are in proportion to the mesh size, and inversely proportional to the maximum velocity. CFL number was set to be 0.4.
2.3 Equation of State
The equation of state (EOS) for each material involved during the reaction must be defined for providing a mathematical closure to the governing conservation laws. Tait EOS and Nobel-Abel EOS are used for the unreacted liquid ZPP particle and the product gas as shown in Eqns. (5) and (6), respectively. One notes the known versatility of Nobel-Abel EOS for common pyrotechnic product gases as used here [13].
Here, B, N, and A are the coefficients of Tait EOS and b represents the covolume of the fluid. Table 1 shows the parameters of EOS. The pressure of the ZPP during a chemical reaction was calculated by mixing Eqns. (5) and (6) according to the mass fraction as shown in Eqn (7).
The speeds of sound for unreacted particle and product gas are calculated by Eqns. (8) and (9).
The sound speed for the mixture is calculated by the mixture rule
Table 1.
Material properties and EOS coefficients.
| Parameter | Zr +KClO4 (Particle) | Viton+Graphite (Binder) |
| (kg/m3) | 3806 | 1770 |
| (J/kg-K) | 536 | 180 |
| (MPa) | 13.6 | 1.2 |
| N | 4.55 | 2.5 |
| A(MPa) | 0.1 | 0.1 |
| b(m3/kg) | 0.001 | - |
2.4 Reaction Model
The premixed particle consisting of Zr and KClO4 was assumed to follow a single step reaction kinetic of the Arrhenius rate law:
The pre-exponential factor and activation energy are exp(30.4) s-1 and 213 kJ/mol from the calorimetry. Temperature is calculated from total energy, and velocities are obtained from solving the momentum equations while assuming a constant heat capacity, 536 J/kg-K.
2.5 Interface Tracking
The level set method is applied to track sharp interfaces between materials, based on the following motion equation.
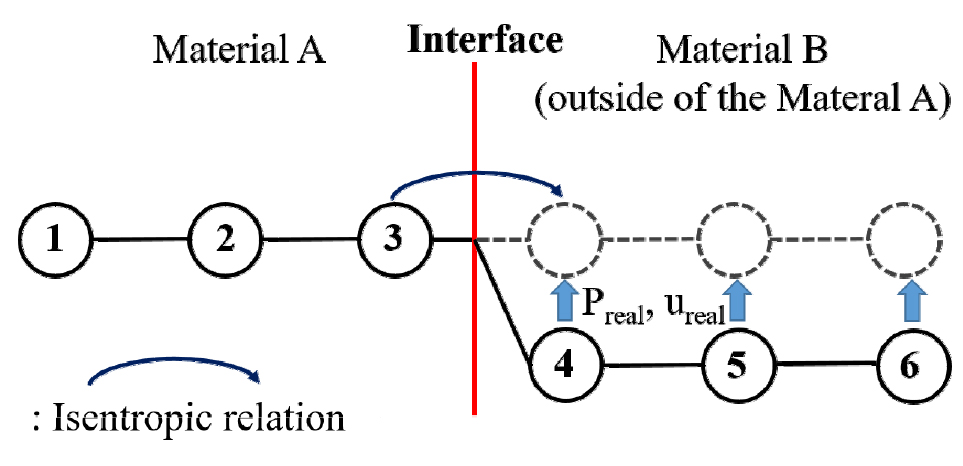
is the level set function that defines the distance from the zero level set interfaces. Thus, indicates the inner side of a particle, and means the outside of a particle. The material properties change drastically across the interface. In particular, entropy discontinuity is known to be the main cause of numerical errors and should be treated well. In this work, the ghost fluid method is applied to calculate material properties across the interface [14]. Fig. 3 shows a schematic of the ghost fluid method in one dimension. One assumes that the left side is inside the ‘material A’ and the right side is inside the ‘material B’. In other words, points 1, 2, and 3 are real nodes, and points 4, 5, and 6 are ghost nodes of material A. The ghost properties of nodes 4, 5, and 6 are used in ENO-Scheme for the material A. The pressure and velocity of the ghost nodes use the real values of real nodes 4, 5, and 6, and the density and internal energy are obtained through isentropic relation from nodes 3, 2, and 1, respectively.
Since the isentropic relation of pressure and density is governed by the equation of state, it can be used as follows.
Since the pressure of the ghost node (4,5,6) and the density and pressure of the real node (3,2,1) are known, the density at the ghost node was calculated using Eqn (14). The secant method was used to numerically solve the two-variable differential equation. In addition, the internal energy can be obtained by reconstructing the EOS as Eqn (15).
As above, the pressure, density, velocity, and internal energy in the ghost nodes were all determined, and this process was applied to each of the two materials, namely the reactive particle and the binder.
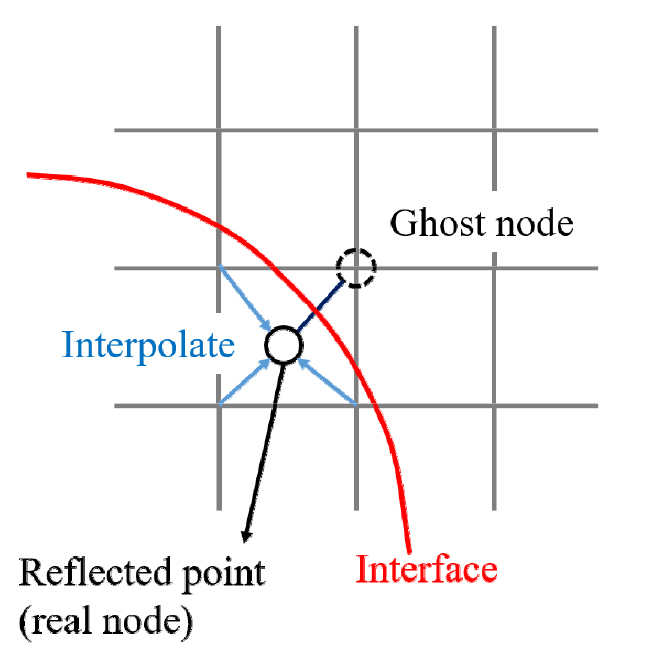
Ghost fluid method in one dimension is extended to two dimensions as shown in Fig. 4. The position of the reflected node inside the material can be calculated using the level set function. The conservative variable of the reflected point is calculated through interpolation from the surrounding real nodes, and the ghost fluid method is applied between the ghost nodes and the reflected nodes in the same way as in one dimension.
3. Results and Discussion
3.1 Reaction rate law verification
The constant volume reaction is performed prior to performing the dimensional simulation. Here, the kinetic model is verified by solving the following system of ordinary differential equations for time evolution of temperature and product mass fraction.
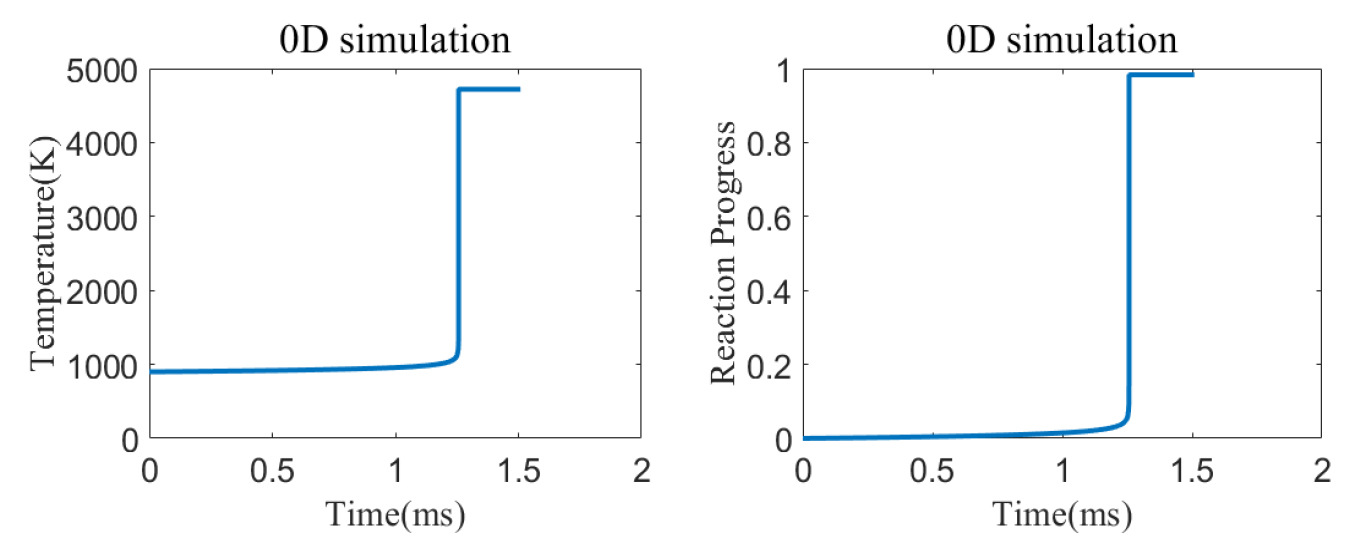
Heat capacity Cv and heat of reaction are 536 J/kg-K and 2721 kJ/kg, respectively. Fig. 5 shows the calculated temperature and reaction progress, where the initial temperature is set to 900 K for initiation of ZPP reaction. Apparently, the reaction time for ZPP is about 1.3 ms. The reaction occurs rather slowly at the beginning and then exponentially accelerates at about 1300 K. The final adiabatic flame temperature is reached at 4748 K.
3.2 Particle reaction
3.2.1. Fast convective burning
Figs. 6 to 8 show randomly embedded multi particles that react in the melt layer. The initial temperature was set to 300 K, and 20% of the upper part of the domain was heated to 1300 K by an external heat source for ignition. The black line indicates the interface between reactive particle and inert binder.
As a result, the reaction progresses downwards as new particles are chemically involved. During the reaction, the pressure of the product gas changes significantly, while it is maintained at approximately 50 MPa near the burning surface. However, large pressure near the burning surface gradually decreases as the product gas expanded. The same trend appears for the density contour. A density of 4000 kg/m3, which is higher than the initial density, emerges near the burning surface.
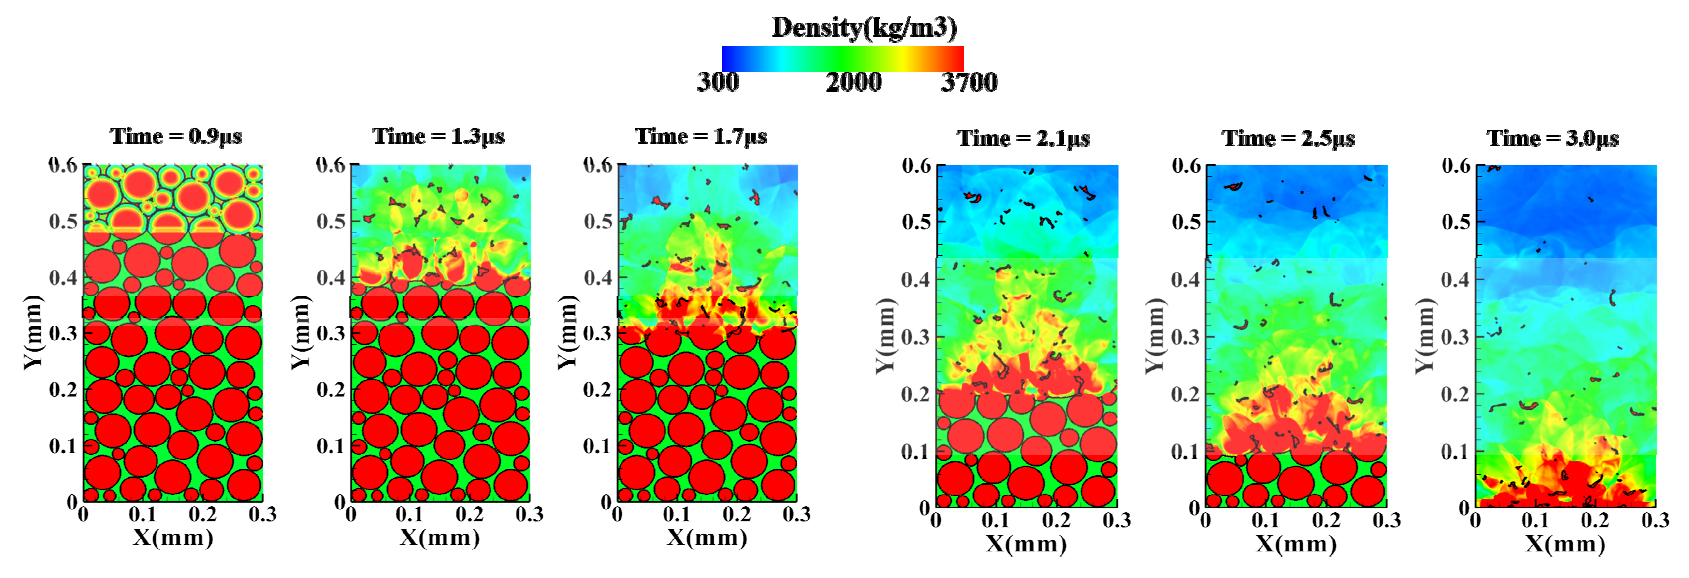
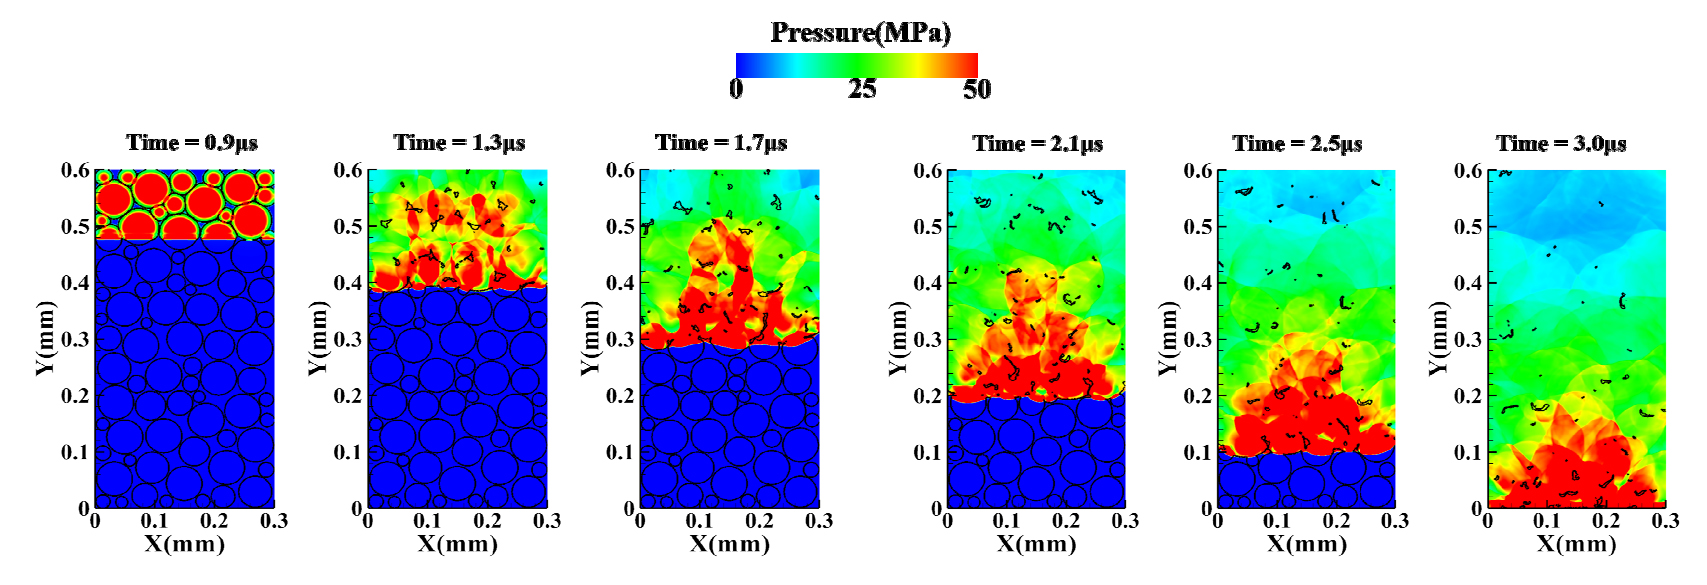
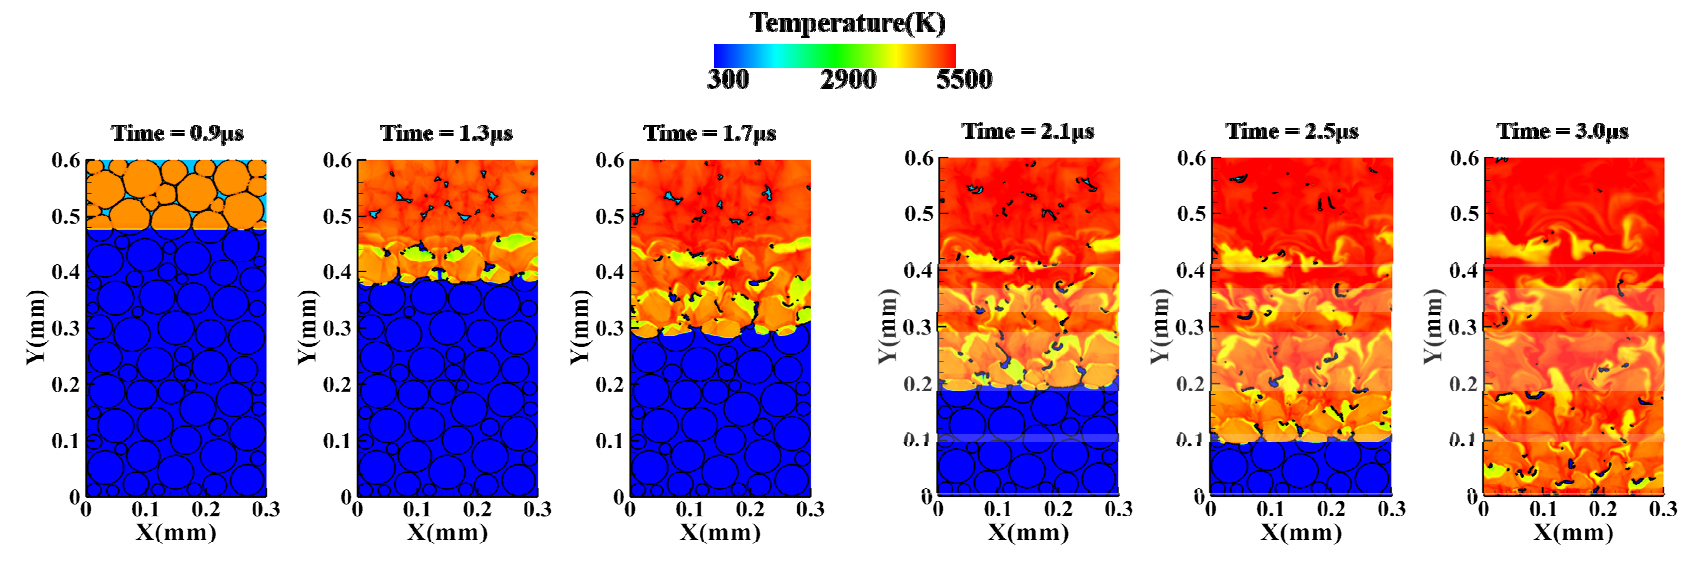
This is because of the agglomeration of the particles due to high pressures of the product gases. The interfaces between particles shown as black lines merge to form high-density, high-pressure regions near the burning surface. As time progresses, the density also gradually decreases along with the pressure as the product gas expands. In addition, the temperature of the reacting particles after the chemical reaction was about 5000 K, which is consistent with the zero-dimensional calculation shown in Fig. 5. Fig. 9 shows the pressure history measured at 0.1 mm height intervals from the centerline of the domain. The exact location is: (x,y) = (0.15 mm, 0.5 mm), (0.15 mm, 0.4 mm), (0.15 mm, 0.3 mm), (0.15 mm, 0.2 mm), (0.15 mm, 0.1 mm).
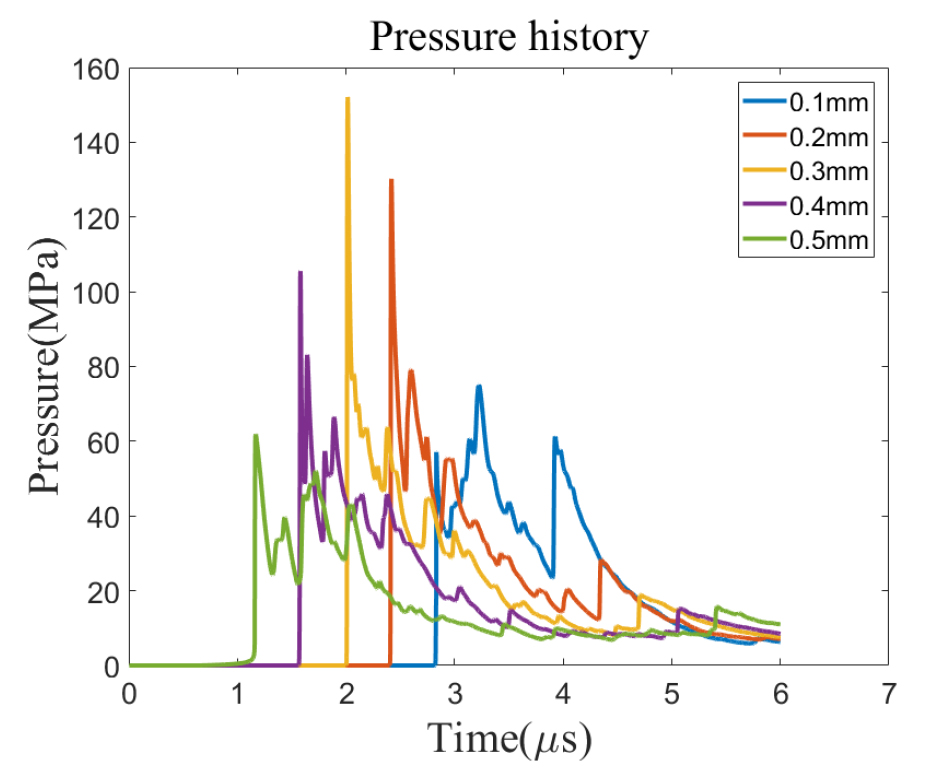
As the convection is dominant in the region, pressure rises rapidly during the chemical reaction. However, pressure decreases due to the expansion of the product gases and converges to a value nearing 10 MPa after 3 μs. Because the particles are randomly distributed, the pressure wave was formed irregularly and perturbation occurred in the pressure history.
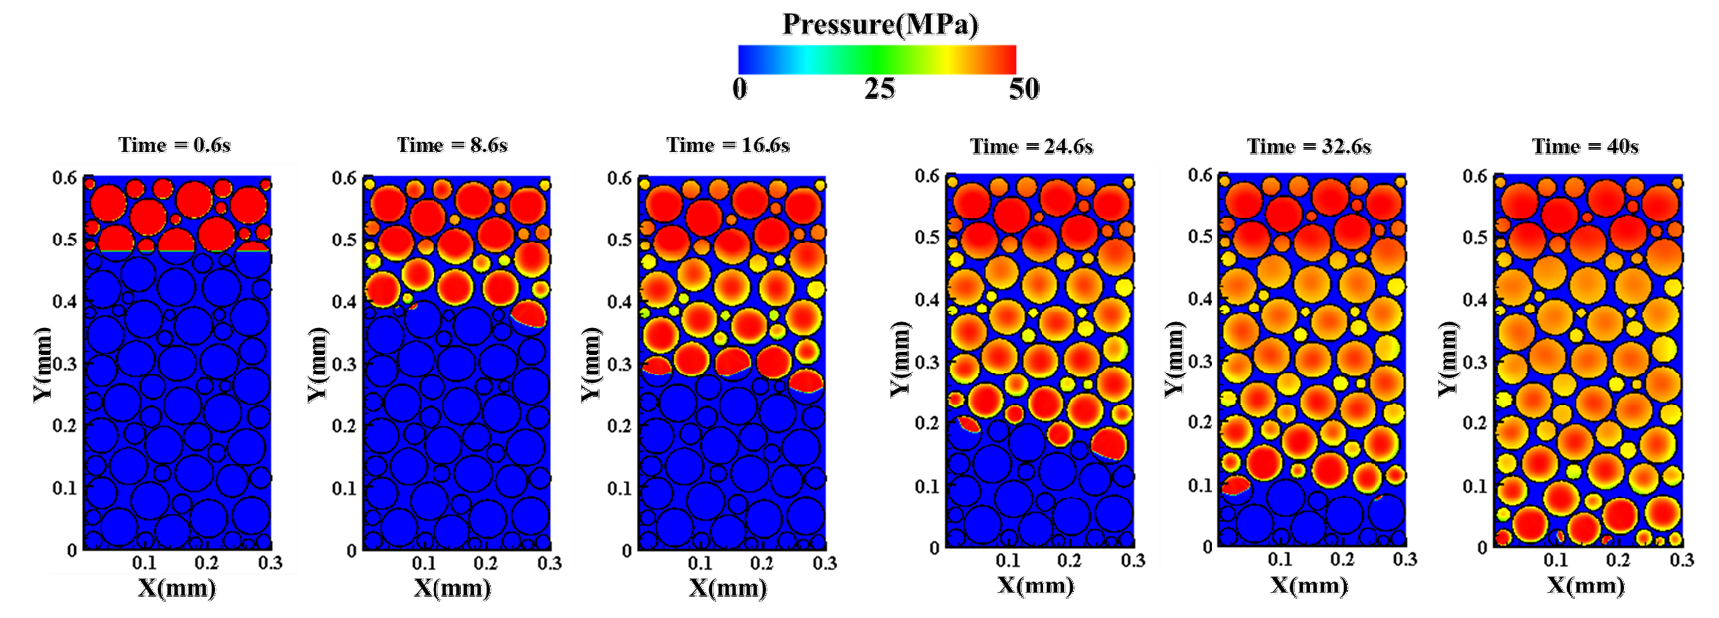
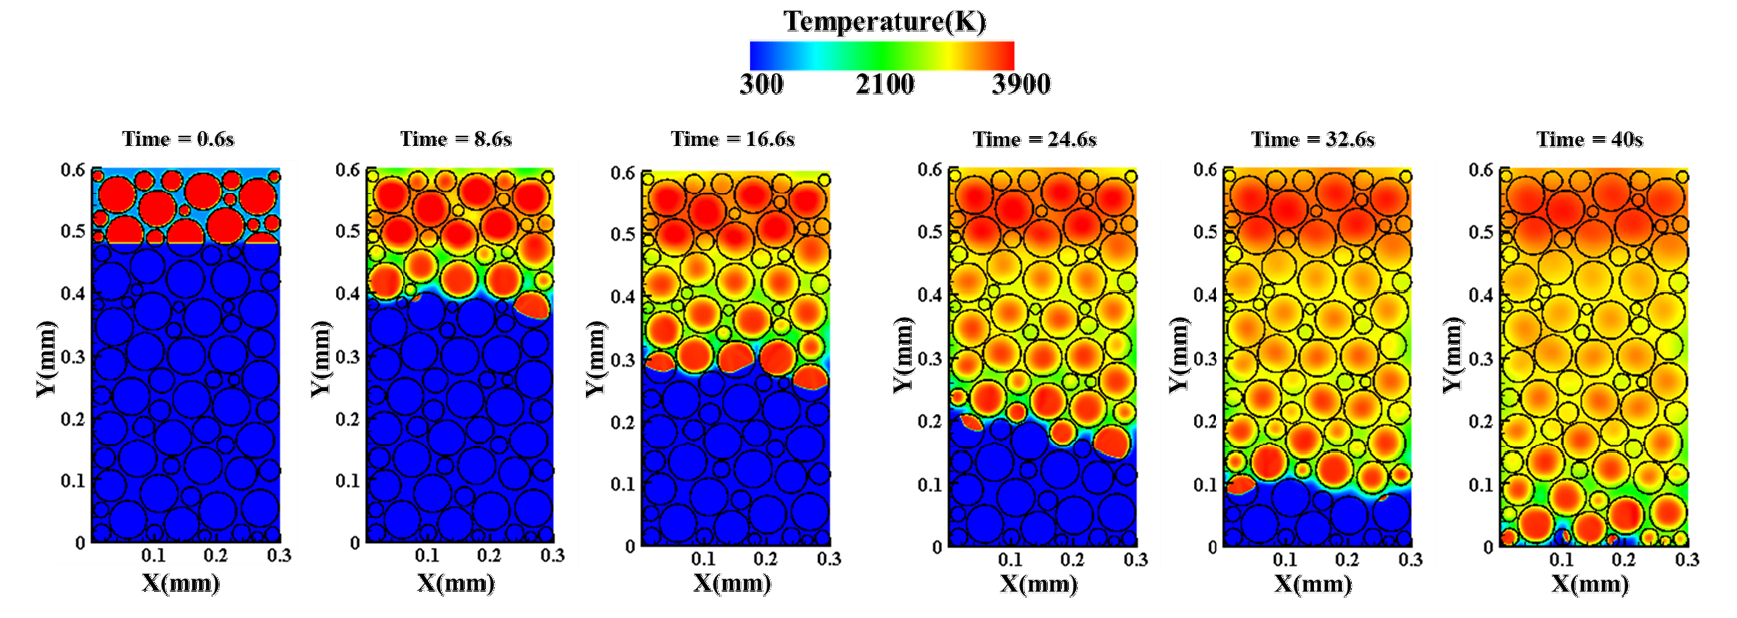
3.2.2. Slow diffusive burning
In actual surface reactions, it is likely that both convection and diffusion would equally affect the burning process. In particular, diffusion may be more dominant than convection in the case where slow deflagration is favored. Figs. 10 and 11 show the diffusion that does not involve the flux of conservation variables. Here, particles are remained in the same position even after they are fully reacted. The final combustion time is measured at 40 sec which is approximately 107 times longer than the time obtained for convective burning.
The maximum pressure in ZPP is about 50 MPa as shown in Fig. 10. However, because the flux is not calculated, the burning surface was not fully affected by this pressure. When the burning rate is calculated, the atmospheric pressure may be considered more dominant than the maximum pressure of the reacting particle.
As before, the location 0.48~0.6 µm from the bottom was heated to 1300 K initially for ignition as illustrated in Fig. 11. The diffusion speed is determined by the diffusivity, mesh size, and temperature gradient. Since the mesh size was kept uniform, only diffusivity and temperature gradient were effective. As the particle reacted, the temperature gradient between hot reactant and cold became quite drastic. This resulted in the diffusion speed inside the particle being significantly faster than that of inert binder. The maximum temperature was about 4700 K, and the temperature range was 300 K to 3900 K as shown in Fig. 11.
3.3 Mesh independence test
To illustrate that the chosen mesh refinement of (300 × 600) is adequate, two additional high levels are tested. Fig. 12 shows the centerline pressure history as considered in Fig. 9, repeated for grid sizes of 500,000 (500 × 1000), 320,000 (400 × 800), and 180,000 (300 × 600).
Due to the randomness of the particle placement, the pressure evolution patterns seem a bit different for each case. Nevertheless, the surface burning rates shown in Table 2 ellucidate the convergence, suggesting the choice of mesh resolution is adequate.
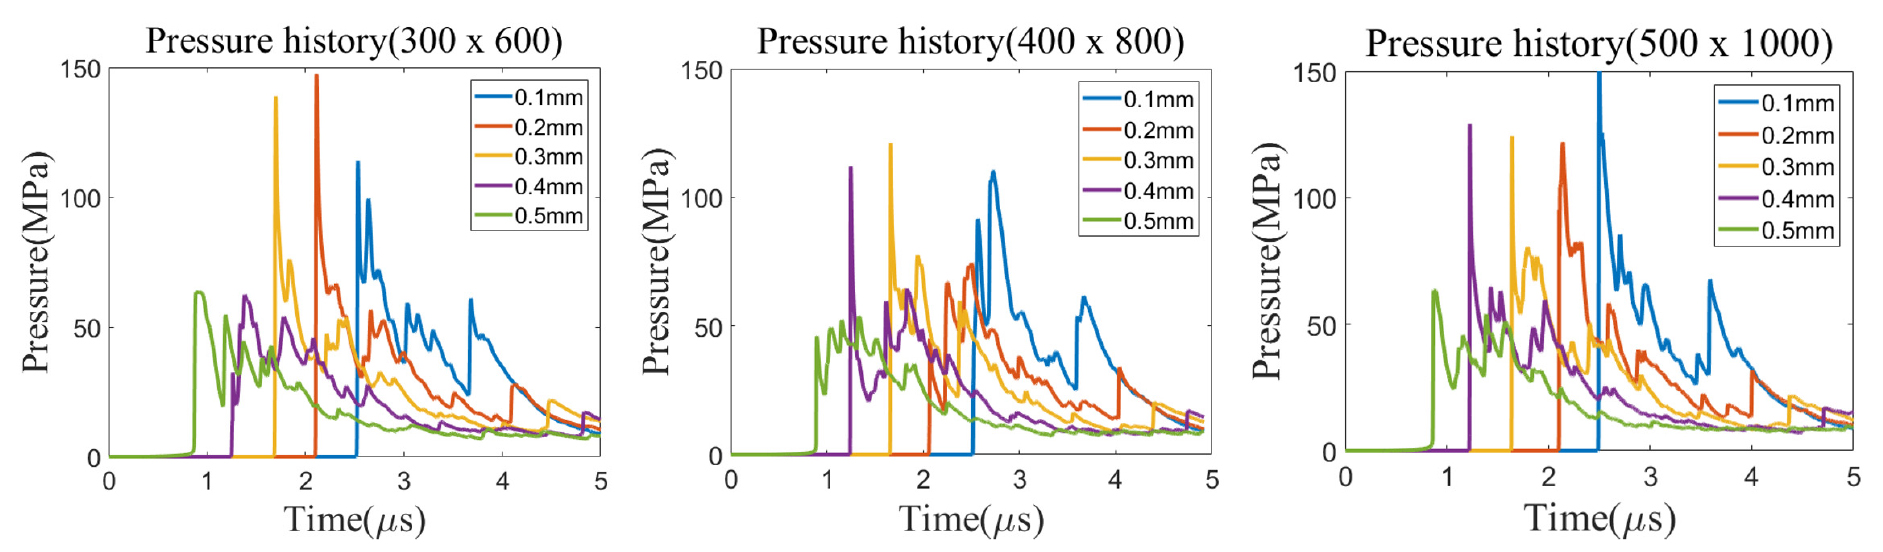
Table 2.
Burning rate comparison for different grid resolutions.
| Grid size | 300 × 600 | 400 × 800 | 500 × 1000 |
| Burning rate (m/s) | 245.9 | 244.0 | 244.4 |
3.4 Burning rates comparison
If ZPP was to undergo a fast reaction viz. Chapman-Jouguet detonation, the corresponding burning speed can be obtained from the thermochemical equilibrium code, CHEETAH 4.0. As for slow deflagration of ZPP, the burning rate would follow the following pressure based empirical expression given by Eqn. (18).
Here, is the burning rate, is burning rate parameter, and is burning rate exponent. For ZPP, the parameter is reported as 19.4 mm/s-MPan and the exponent is 0.47 [15]. Taking into account two pressure conditions, namely maximum pressure during reaction and ambient pressure, the burning rates are summarized in Table 3.
Table 3.
Burning rate comparison between experiment and simulation.
| Burning rate (m/s) | |
| CHEETAH | 7.0 × 10² |
| Eqn. (18) using maximum pressure | 1.3 × 10⁻¹ |
| Eqn. (18) using ambient pressure | 6.1 × 10⁻³ |
| Convection dominant burning | 2.4 × 10² |
| Diffusion dominant burning | 1.3 × 10⁻⁵ |
The convective burning showed the fast burning speed resembling the value obtained from CHEETAH calculation, indicative of a near C-J detonation velocity. As for slower deflagration, the diffusion dominant burning showed a speed on the order of µm/s which approximates to a thousand times lower value in comparison to empirical value.
As the intent of present research is to acquire the end limits of burning rates, namely slow diffusion as well as fast detonation, the work in progress is geared toward acquiring more realistic burning of the metalized energetic substance subjected to thermal ignition. To do so, both diffusive and convective features must be handled simultaneously. Moreover, the complex surface burning that involves particle interactions in addition to the thermo-chemical process should also be handled all together.
4. Conclusions
Numerical modeling of melt layer of metalized energetic substance in mesoscale is discussed. Earlier studies have assumed rigid and perfectly spherical particles in gas phase, thus not taking into account the structural changes which always precede well before chemical reactions take place. The use of level sets embraced by the ghost fluid method framework allowed for smooth interface breaking and merging while unambiguously defining the interfacial properties extrapolated from particle-binder at contact. The findings elucidate that there exist strong competitions amongst the hydrodynamic pressure from hot product gas generation, heat diffusion across multi-granular interfaces of varying reaction rates, and interfacial interactions associated with the deforming particles during the burning process. It is apparent that mesoscale handling of the metalized fuel requires a full coupling of both slow and fast reactive processes that are also closely tied to the interfacial dynamics of particles and binder.
