

1. Introduction
2. Method of Research
2.1 Target Combustor for Analysis
2.2 1D network model
3. Results and Discussion
3.1 CFD analysis results
4. Conclusion
1. Introduction
The global pursuit of carbon neutrality has positioned hydrogen as a promising carbon-free energy carrier, with substantial potential in the power generation sector [1,2,3]. Among the available transition pathways, retrofit technology [4]—which enables existing natural gas turbine systems to operate on hydrogen—offers distinct advantages in both economic viability and practical deployment, as it leverages established infrastructure. By modifying nozzle geometry and fuel-air mixing strategies to accommodate hydrogen’s unique combustion characteristics, such retrofits can achieve stable combustion while mitigating nitrogen oxides (NOx) emissions, without major hardware redesign.
These benefits have spurred intensive research on hydrogen turbine retrofitting worldwide. Efforts range from experimental studies targeting flame stabilization and emission control to advanced computational and modeling approaches that complement experimental findings. For instance, Yang et al. [5] demonstrated that hydrogen-methane blended combustion can sustain low NOx and CO emissions while maintaining high stability across varying hydrogen ratios. Pignatelli et al. [6] highlighted the stabilizing role of hydrogen addition, albeit with a tendency to elevate CO emissions. Liu et al. [7] achieved stable combustion with up to 40% hydrogen in a multi-nozzle combustor. Complementary simulation-based investigations by Serbin et al. [8] and Liu et al. [9] revealed the effects of hydrogen blending on fuel-air mixing, flashback mechanisms, and flame structure. Du et al. [10] further demonstrated that swirler geometry optimization can enhance stability and reduce emissions under hydrogen-enriched conditions. Concurrently, leading turbine manufacturers including GE, Siemens, and Mitsubishi are advancing high-hydrogen-capable, high-efficiency turbine platforms [11,12,13,14].
In Korea, research momentum is likewise accelerating. Jin et al. [15], Kang and Kim [16] experimentally examined flame structure and emission trends under hydrogen-natural gas blends, while Choi et al. [17], Lee et al. [18] applied computational fluid dynamics (CFD) to assess turbulent flame behavior and pollutant formation in hydrogen combustors. Collectively, these studies provide a foundation for understanding hydrogen combustion fundamentals across blending regimes.
Despite this progress, most prior work remains limited to performance and emission assessments, with insufficient focus on quantitative diagnosis of combustion instability mechanisms. Hydrogen’s low ignition energy, high laminar flame speed, and large diffusion coefficient significantly increase susceptibility to flashback, abrupt flame topology changes, and localized thermal load concentrations [19,20,21,22]. Such conditions can trigger pressure oscillations that couple with the combustor’s acoustic modes, potentially leading to self-excited instabilities detrimental to operational reliability.
These effects are most severe under high-load, high-efficiency operation, underscoring the need for a quantitative understanding of how instability correlates with design variables. However, few studies have systematically linked the onset of instability to specific parameters—such as hydrogen fraction or nozzle geometry—through integrated CFD-thermoacoustic modeling validated by experiments.
Here, we quantitatively investigate the impact of hydrogen blending ratio and nozzle configuration on combustion instability using CFD in conjunction with a one-dimensional network thermoacoustic model, benchmarked against experimental measurements. This integrated approach elucidates the physical mechanisms governing instability in hydrogen-enriched combustion and offers simulation-driven design guidance for stable, low-emission turbine operation. The insights gained are intended to accelerate the commercialization of hydrogen-fueled turbines while ensuring compliance with increasingly stringent environmental standards.
2. Method of Research
2.1 Target Combustor for Analysis
Fig. 1(a) shows a schematic of the laboratory-scale combustion test rig developed in this study, which was designed to achieve up to 50% hydrogen co-firing. Both air and fuel are supplied in a fully premixed manner. The flow rates of air and fuel were precisely controlled using mass-flow controllers (MFCs): a Bronkhorst F-206BI for air and a Bronkhorst F-201AV for fuel, providing measurement accuracies of ±0.8 % and ±0.5 %, respectively [23].
Before entering the combustion chamber, the premixed mixture passes through a choke plate and a set of swirl vanes with a swirl number of 0.6. A quartz window is installed at the front of the combustion chamber for flame visualization, while a plug at the downstream end allows the chamber length to be adjusted and establishes a closed-end acoustic boundary condition. Ten dynamic pressure transducers are positioned between the nozzle tip and the plug to measure the acoustic characteristics inside the chamber.
Fig. 1(b) presents the original nozzle geometry, whereas Fig. 1(c) shows the modified bluff-body-type (retrofit) nozzle. The modified design incorporates a central cooling-air passage to mitigate flashback risks under hydrogen co-firing conditions.
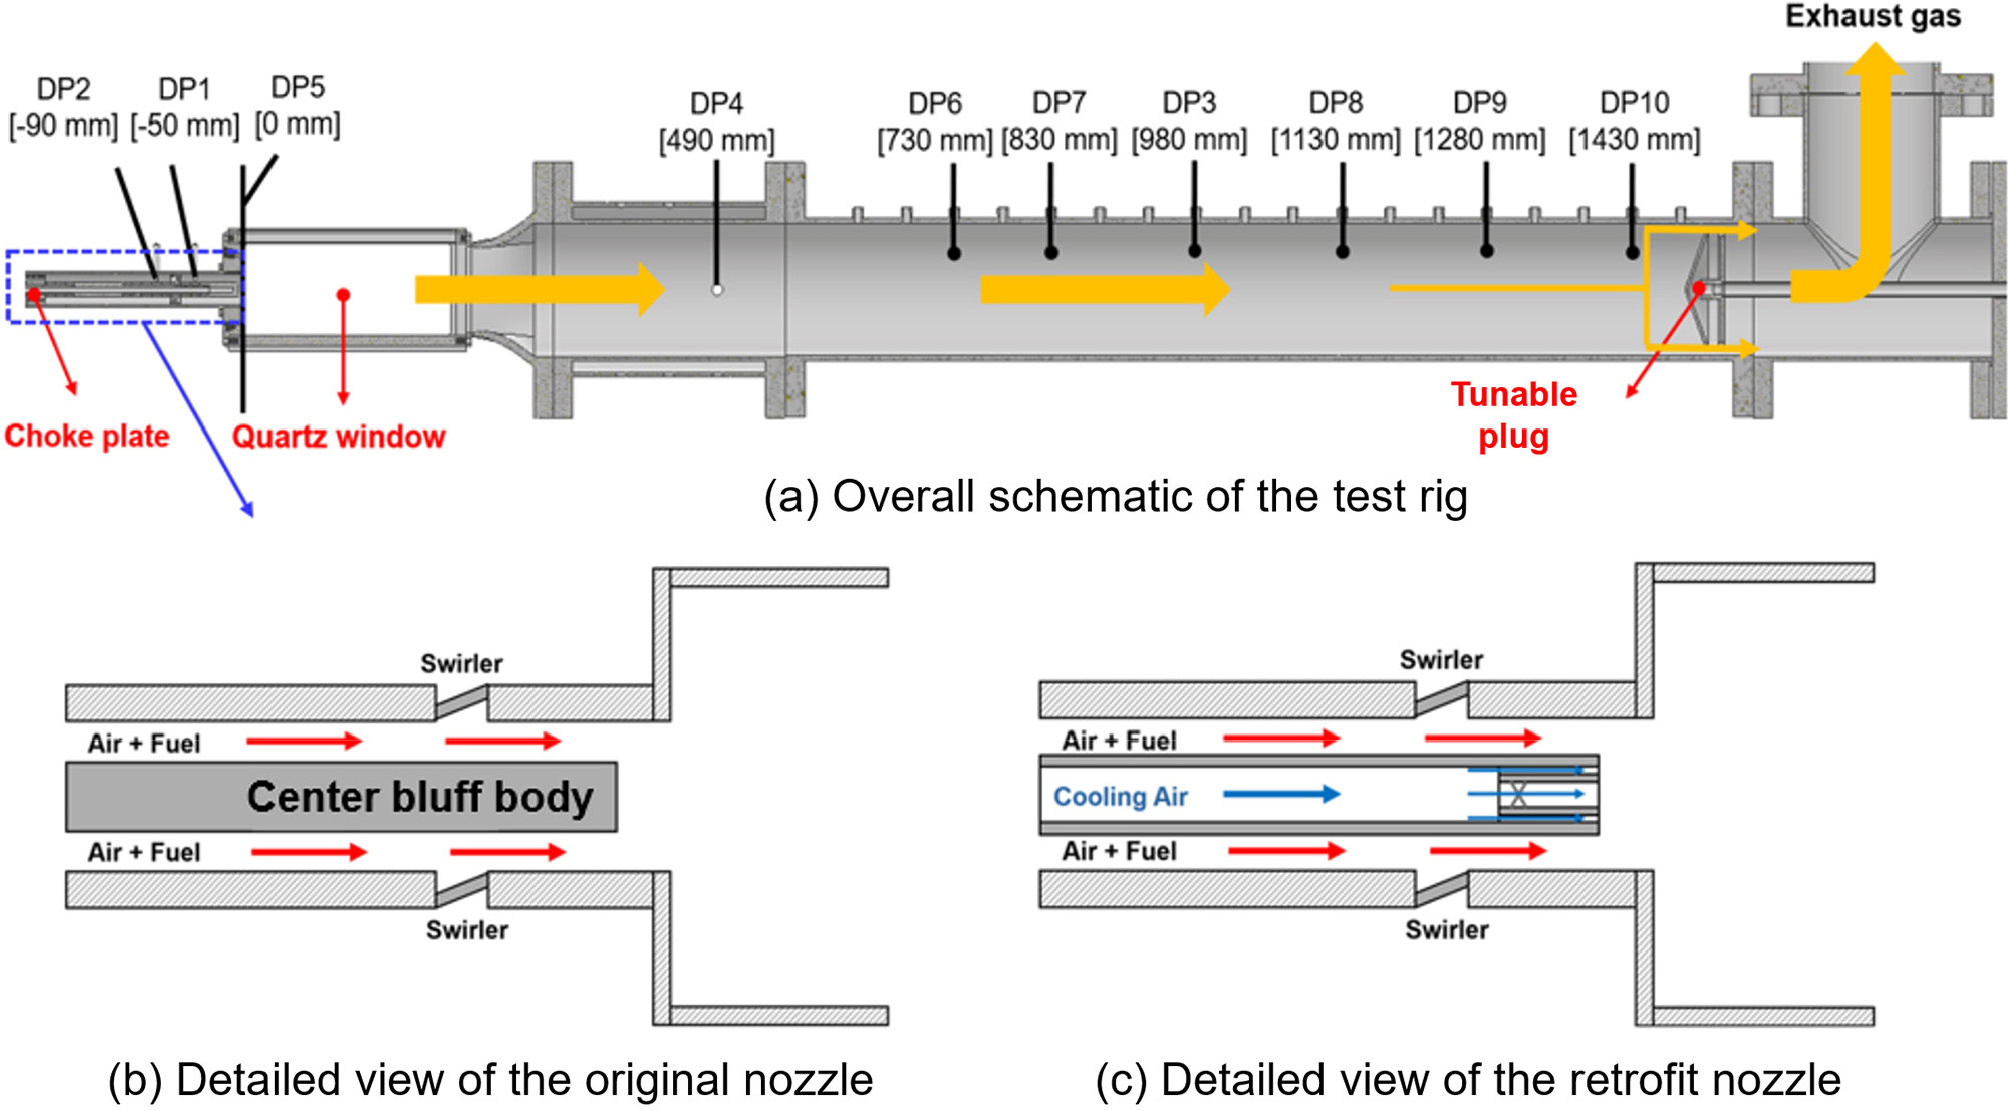
Table 1 summarizes the experimental conditions analyzed in this study. The experiments were conducted to examine the effects of hydrogen co-firing ratio and nozzle geometry on combustion instability. The hydrogen co-firing ratio was varied in increments of 0%, 30%, and 50%. Throughout the experiments, the equivalence ratio and nozzle exit velocity were maintained at constant values to ensure precise comparison of the effects associated with different hydrogen co-firing ratios.
Table 1.
Operating conditions of the lab-scale test rig.
2.2 1D network model
2.2.1 Governing equations
The network model implemented in this study was developed based on the same modeling assumptions used by the authors in a previous work [24]. Subsequently, the perturbation components of pressure, density, and velocity were decomposed and expressed as shown in Eqs. (1), (2), (3), (4).
In Eqs. (1), (2), (3), (4), denotes the amplitude of the acoustic wave, the superscript ^ represents the perturbation component, and the subscripts ± indicate the upstream and downstream positions of the acoustic wave, respectively. The symbols kkk and nnn refer to the axial and circumferential wavenumbers, respectively. To apply each perturbation component to the network model, the transfer matrix method was employed, expressing the formulation in matrix form as shown in Eq. (5), where the matrices and are defined in Eqs. (6), (7).
Subsequently, by accounting for wave propagation in the axial direction and variations in cross-sectional area, the perturbation components in Eq. (5) can be transformed into the forms of the mass, momentum, and energy equations, as expressed in Eq. (8). In Eq. (8), the matrix is given by Eq. (9).
In the network model, wave propagation in the axial direction is represented using a propagation matrix, as given in Eq. (10).
In regions where the cross-sectional area varies, the conservation conditions must be satisfied for both the mean flow and the perturbation components. To ensure these conditions are met, the modified conservation equations presented in Eq. (12) were applied.
Here, the subscripts 1 and 2 denote the states before and after the area change, respectively.
2.2.2 Heat release fluctuation model
In the network model, heat perturbation must be accounted for when analyzing combustion instability. For this purpose, a heat perturbation term, is added to the model, as shown in Eq. (13), to incorporate the effects of heat perturbations.
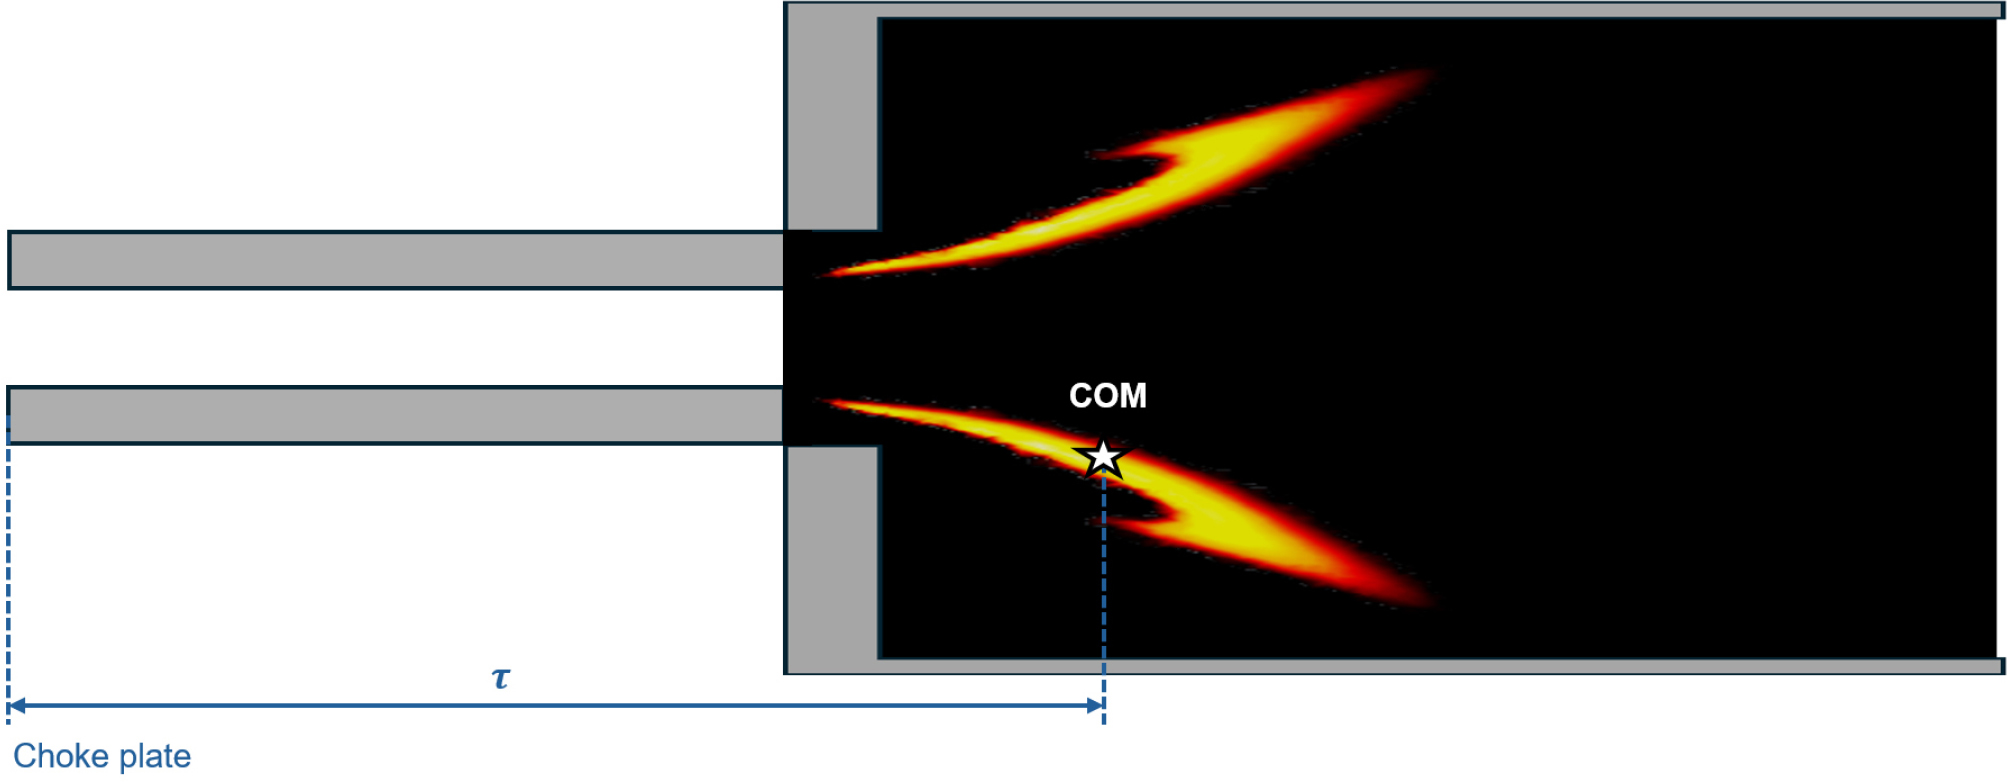
In the network model, the heat perturbation term can be expressed through a flame transfer function. In this study, the model, which accounts for a time delay (𝜏), was employed, as shown in Eq. (14)[25,26]. In Eq. (14), and 𝜏 represent the gain and the time delay, respectively.
Fig. 2 illustrates the method used to determine the time delay 𝜏 by utilizing the OH concentration results obtained from the CFD analysis. Here, 𝜏 is defined as the distance from the choke plate, where the velocity perturbation originates, to the COM location. Finally, the gain value in Eq. (14) was evaluated through a case study.
2.2.3 Analysis conditions
For combustion instability analysis using the network model, it is essential to set boundary conditions that appropriately reflect the acoustic characteristics at the inlet and outlet of the combustion system. In the present test rig, a choke plate was installed at the combustor inlet, and its acoustic reflection characteristics were taken into account. To this end, the inlet reflection coefficient was obtained through the Two Microphone Method (TMM) experiment, and the real part (Θ) and imaginary part (X) of the transfer function were estimated based on the Bode plot. Using these results, an impedance-based acoustic boundary condition was applied at the inlet according to Eq. (15), enabling the quantitative calculation of the amplitude of pressure perturbations generated at the inlet.
For the outlet boundary condition, the plug installed at the downstream end of the combustor leaves only a very small open area; therefore, an acoustically closed condition was applied. Fig. 3 illustrates the configuration of the one-dimensional network model, which was implemented based on the governing equations presented in Section 2.1.1. For modeling purposes, the entire domain was divided into three sections to account for the different acoustic properties in each region. The acoustic properties and boundary conditions applied to each section in the analysis are summarized in Table 2.
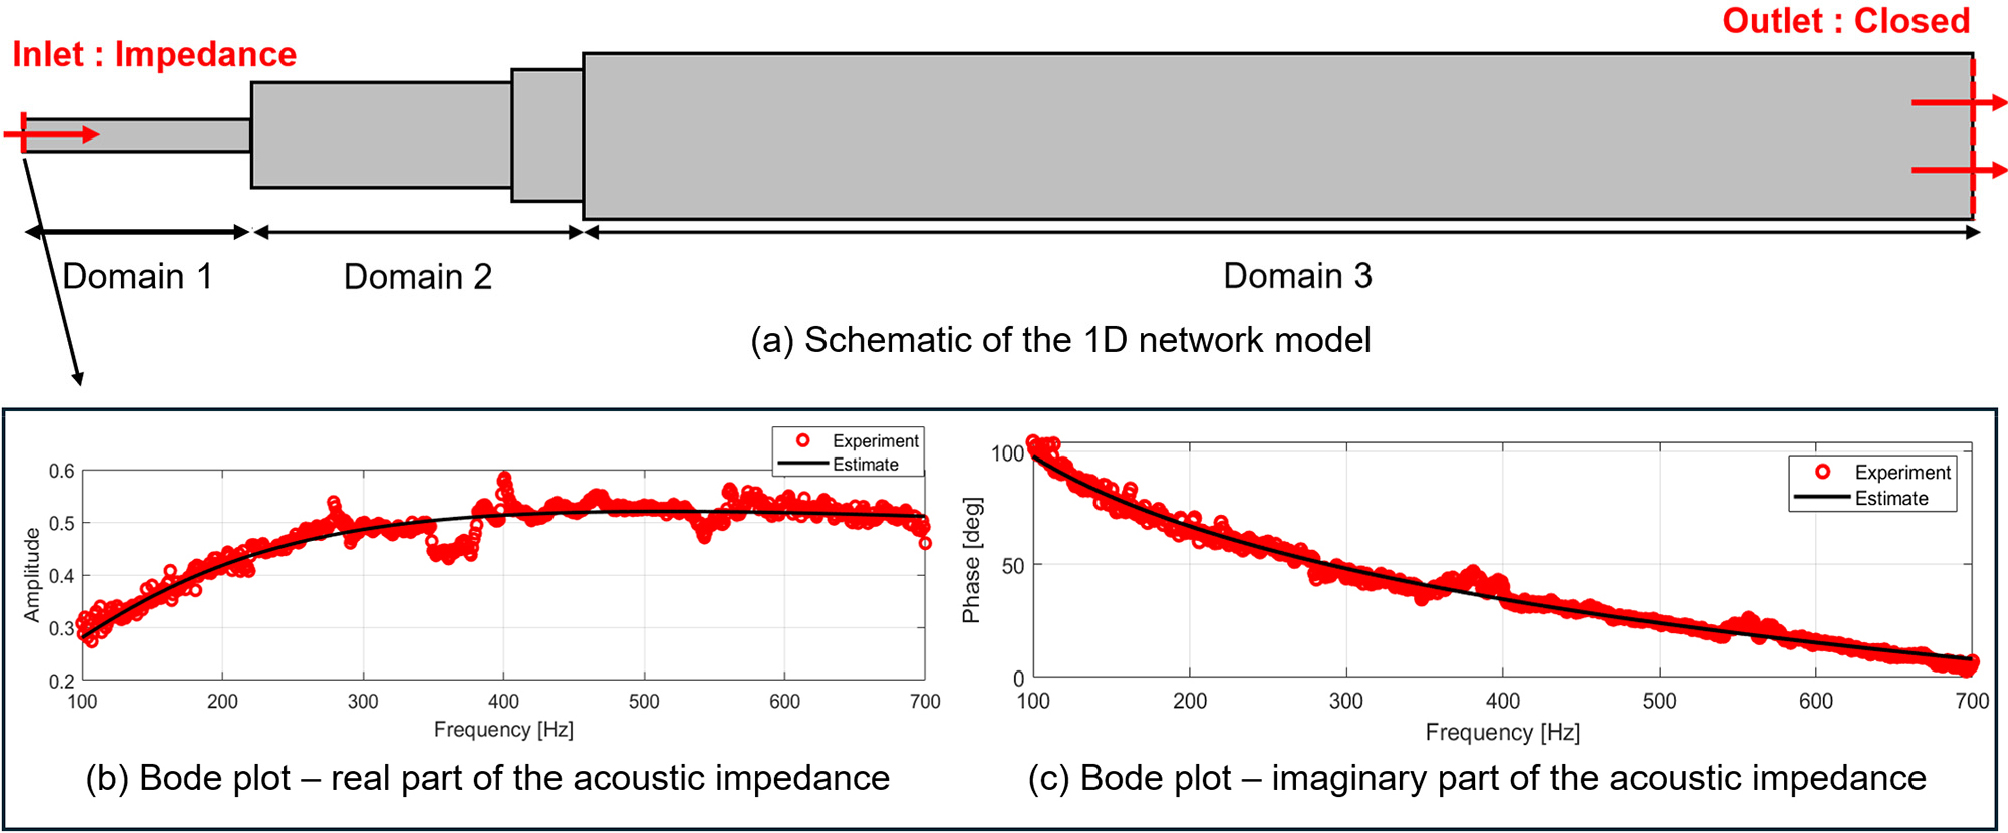
Table 2.
Acoustic parameters and boundary conditions.
| Parameter | Domain 1 | Domain 2 | Domain 3 |
| Pressure [atm] | 1 | ||
| Temperature [K] | 600 | 2236 | 1050 |
| Density [kg/m3] | 0.58 | 0.16 | 0.33 |
| Speed of sound [m/s] | 491 | 975 | 649 |
2.2.4 Set up of the CFD Model
To derive 𝜏 in Eq. (14) of Section 2.1.3, steady-state CFD simulations were performed. The commercial software ANSYS Fluent V22 was employed for the analysis, with the SST turbulence model [27,28] adopted. The SST model enables accurate turbulence prediction both in free-stream regions and near-wall regions, making it well-suited for complex flow environments such as gas turbines. For combustion modeling, the Eddy Dissipation Concept (EDC) model was utilized, which is a mixing-controlled model where the chemical reaction rate is limited by the turbulence dissipation rate, making it appropriate for gas turbine combustor simulations under high-turbulence conditions. Radiative heat transfer was modeled using the Discrete Ordinates (DO) method. For the chemical reaction mechanism, the GRI 3.0 mechanism [29,30], widely used and validated in numerous hydrogen co-firing combustion studies, was applied.
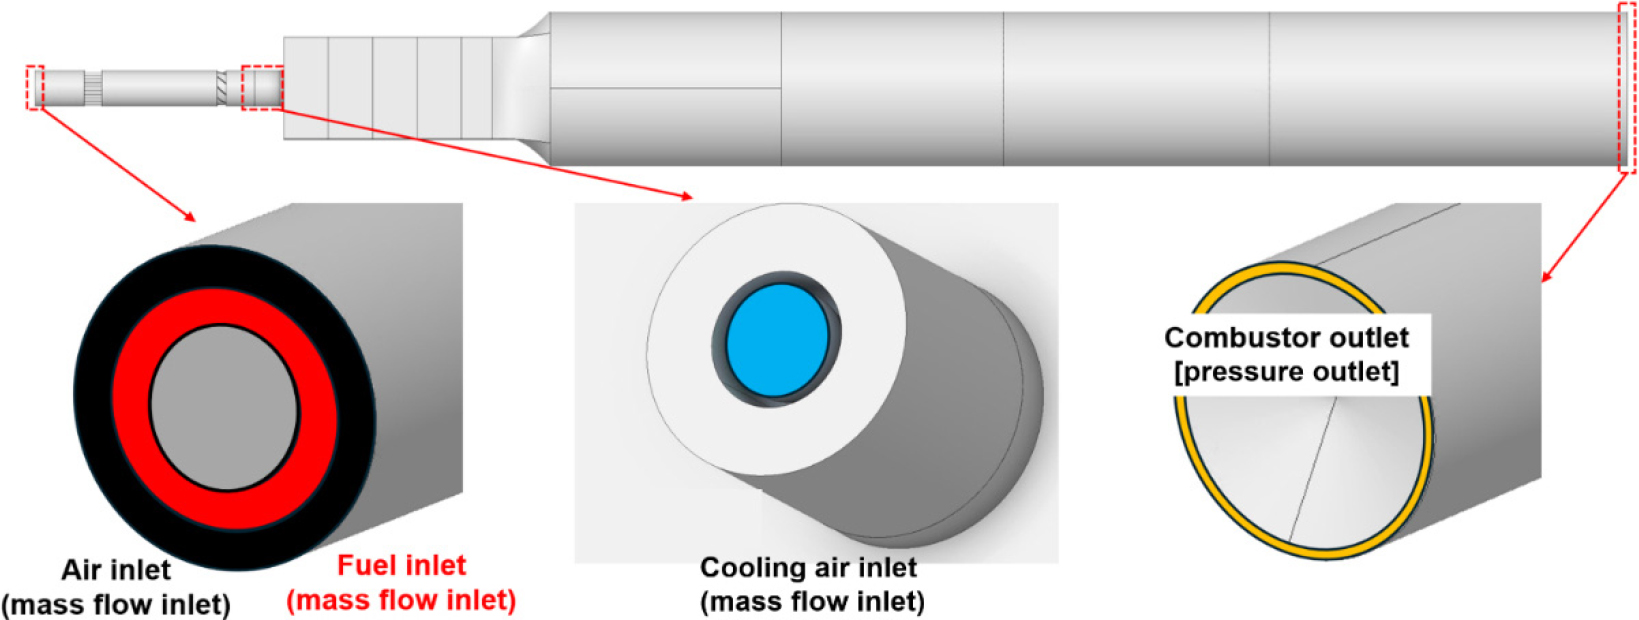
Fig. 4 presents the computational domain and boundary conditions used in the CFD analysis. The nozzle geometry and operating principle are identical to those in Fig. 1. For the retrofit nozzle, a separate inlet boundary condition was specified to account for the introduction of cooling air through the central passage.
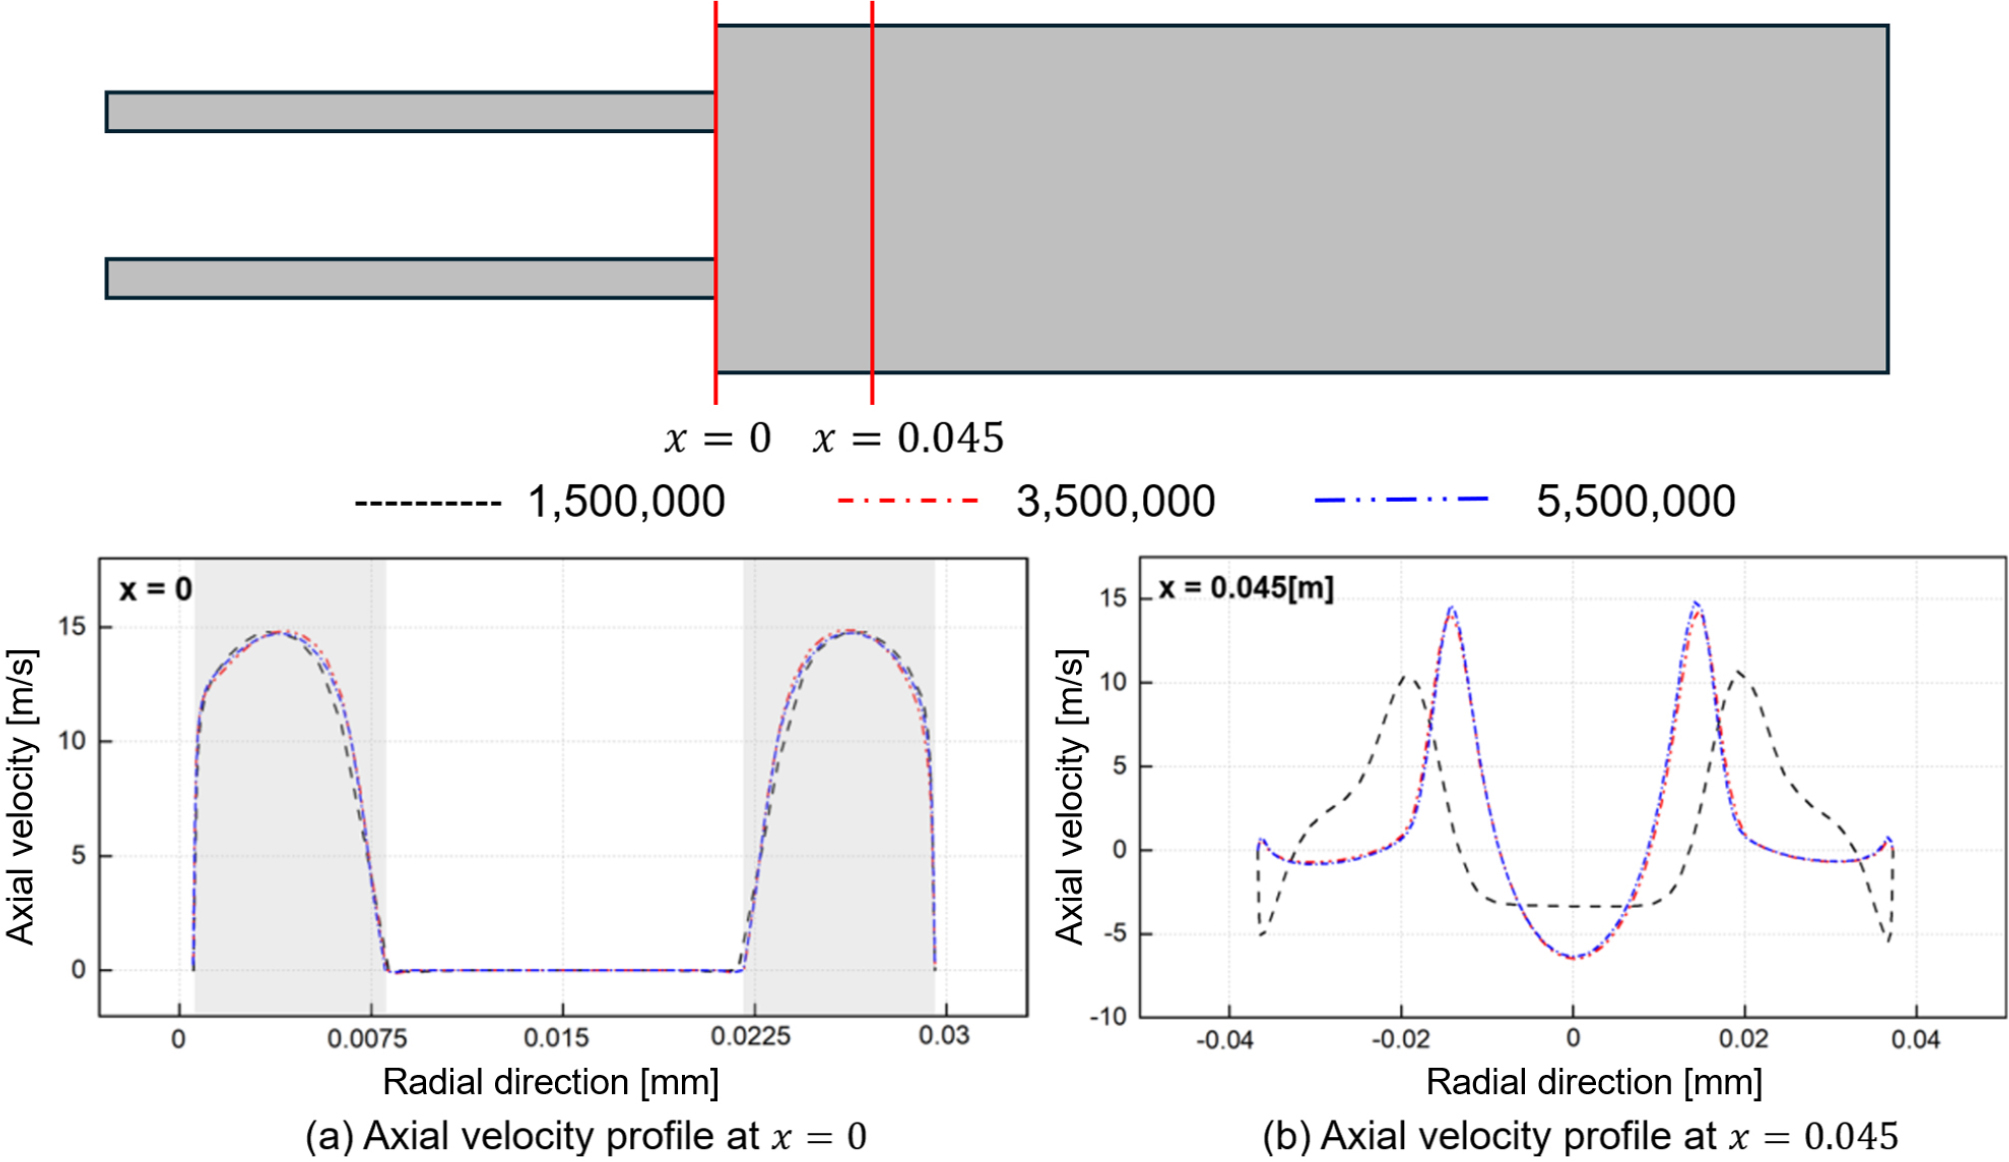
Subsequently, a grid independence test was performed to determine the optimal grid configuration for the numerical analysis, and the results are presented in Fig. 5. In this study, three polyhedral grids with different densities were employed for the assessment. The comparison was based on axial velocity distributions measured at the dump plane and at a location 45 mm downstream of the dump plane. While all three grids exhibited similar velocity profiles at the dump plane, the 1.5-million-cell grid showed a noticeable deviation from the 5.5-million-cell grid at the 45 mm location. In contrast, the 3.5-million-cell grid produced results comparable to those of the 5.5-million-cell grid. Considering both computational efficiency and accuracy, the 3.5-million-cell grid was selected for the present study.
3. Results and Discussion
3.1 CFD analysis results
Before performing the CFD analysis for different hydrogen co-firing ratios and nozzle geometries, the reliability of the simulation model was validated. For this purpose, OH chemiluminescence images obtained experimentally under hydrogen co-firing ratios of 30% and 50% were used as reference data, and the results were compared with OH concentration distributions from the CFD simulations. As shown in Fig. 6, the experimental results indicated that the OH radical flame front progressively shifted toward the dump plane as the hydrogen co-firing ratio increased. In particular, for the retrofit nozzle, the flame front was observed to be noticeably closer to the dump plane compared with the original nozzle under the same co-firing conditions. This trend was generally well reproduced by the CFD results. The flame lift-off phenomenon in the retrofit nozzle was also clearly captured, thereby confirming the reliability of the simulation model. Based on this validated model, CFD analyses were subsequently carried out to investigate the effects of the hydrogen co-firing ratio and nozzle geometry.
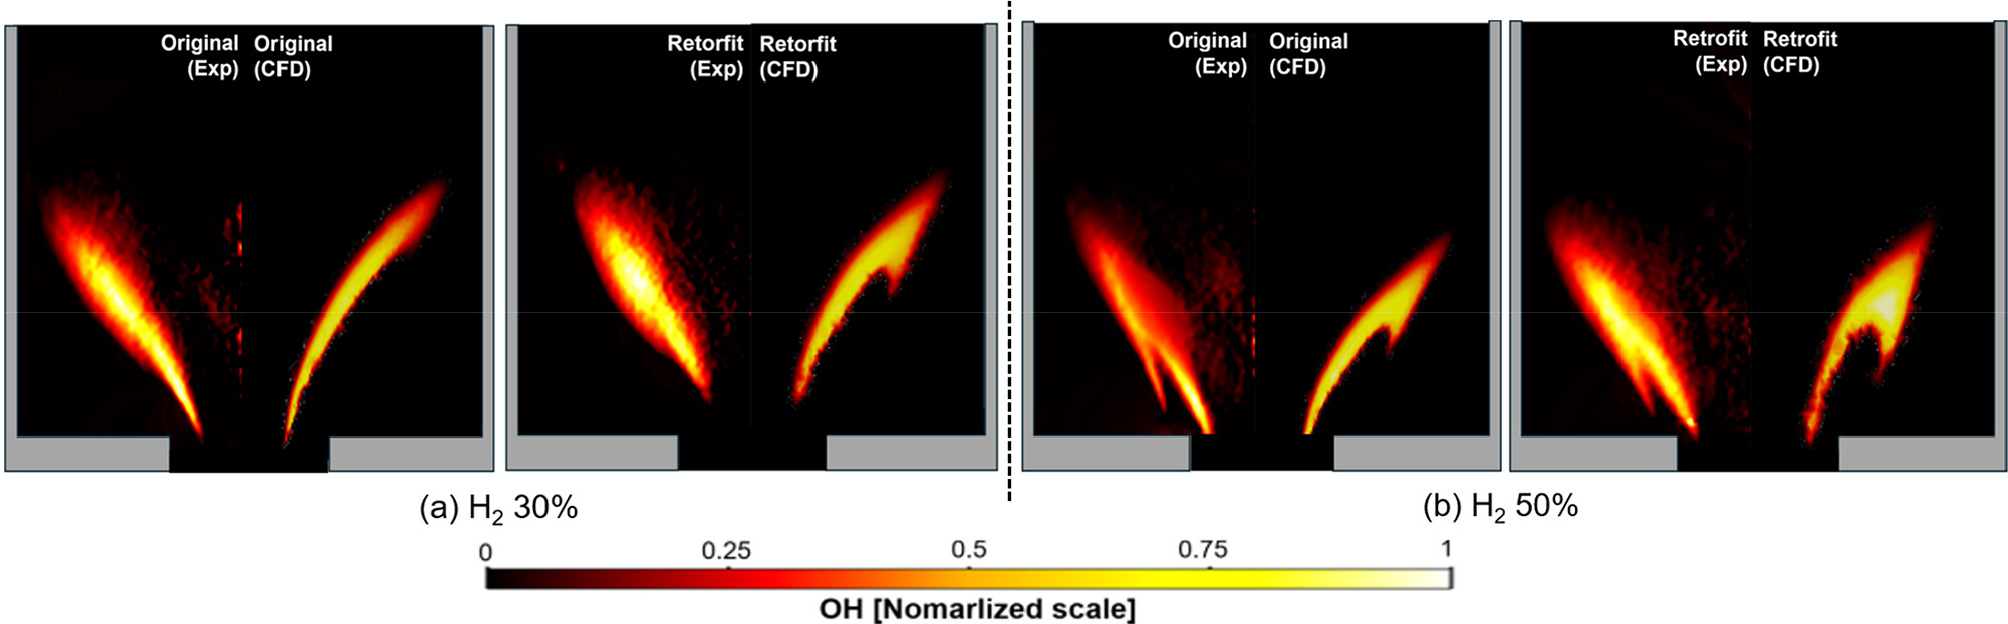
Fig. 7 compares the temperature distributions for different nozzle geometries under hydrogen co-firing ratios of 0% and 50%, presenting the temperature fields for both the original and retrofit nozzles. In each case, high-temperature regions exceeding 70% of the maximum temperature are outlined with solid black lines, and these regions were analyzed to quantitatively compare changes in flame shape. The comparison showed that, for the original nozzle, the flame remained attached to the nozzle tip under both conditions, whereas the retrofit nozzle exhibited a lifted-flame structure, with the flame front positioned a certain distance downstream from the nozzle tip. This behavior is attributed to the inflow of cooling air through the central passage of the retrofit nozzle, which lowers the central temperature and shifts the flame downstream.
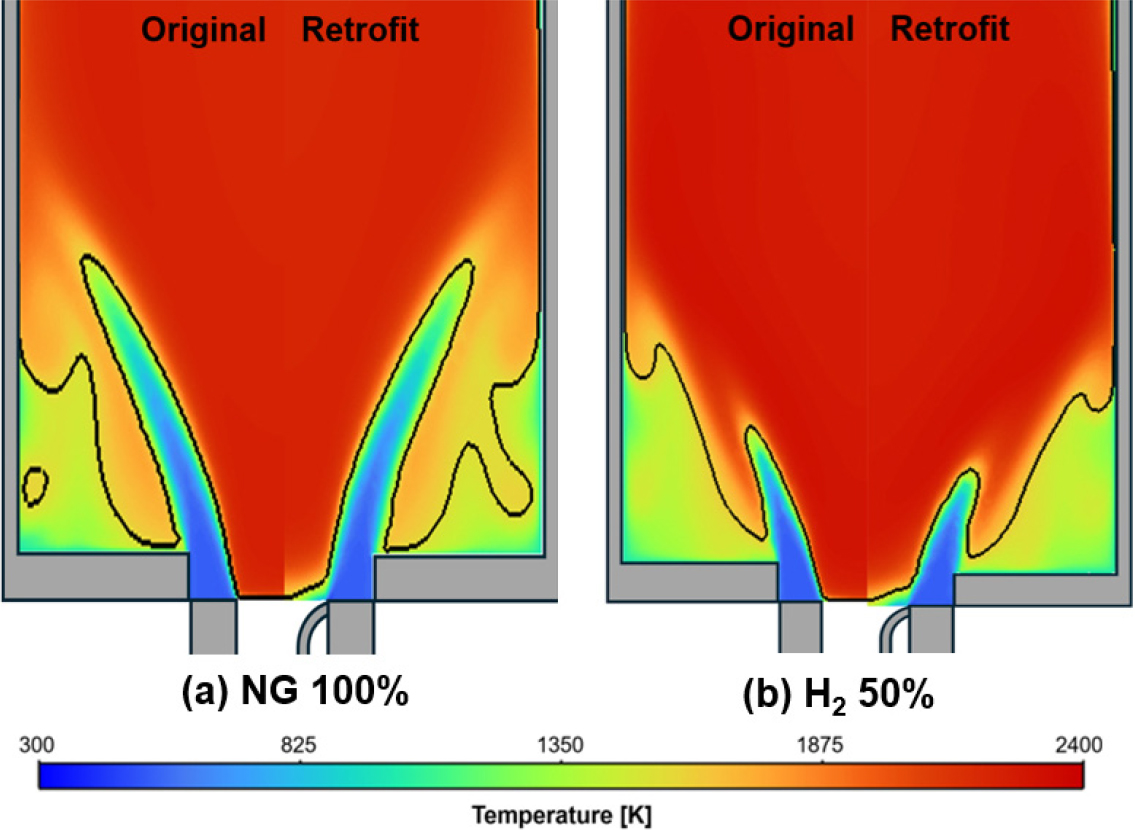
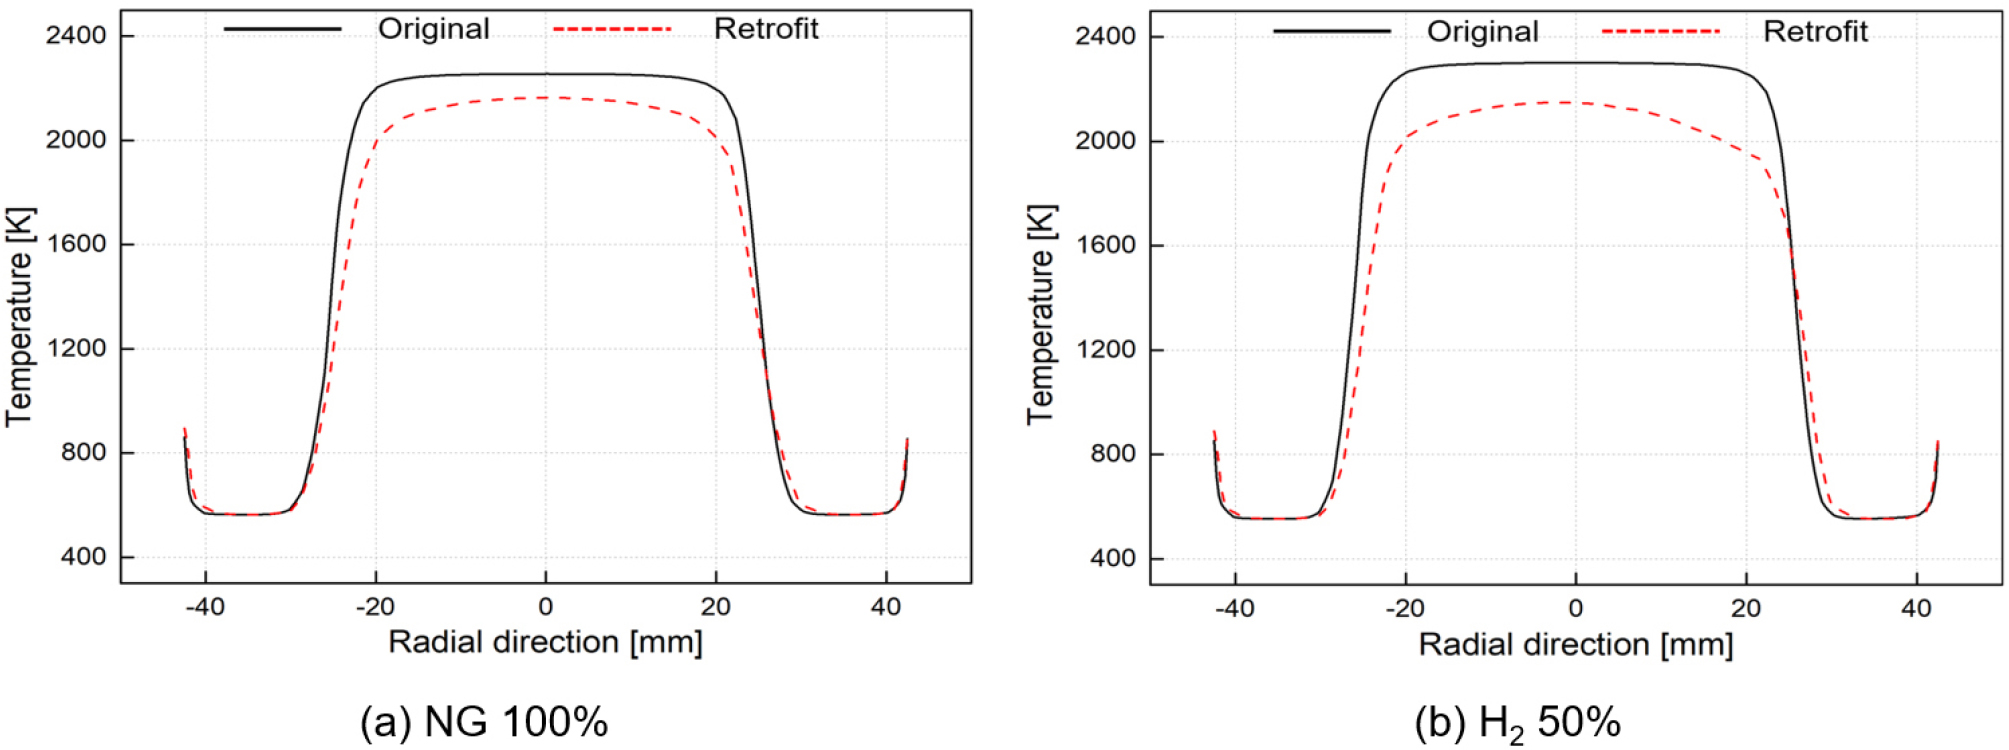
Fig. 8(a) and 8(b) compare the axial temperature distributions on the dump plane under hydrogen co-firing ratios of 0% and 50%, respectively. The analysis indicates that, for the original nozzle, the central temperature was relatively higher than that of the retrofit nozzle in both conditions. This is attributed to the flame remaining attached to the nozzle tip, as observed in Fig. 7. In contrast, the retrofit nozzle maintained a lower central temperature due to the inflow of cooling air through its central passage, with the flame exhibiting a lifted structure separated from the nozzle tip. As a result, the temperature distribution shifted downstream. These differences in temperature distribution underscore the influence of nozzle geometry and cooling-air inflow on flame structure and thermal characteristics.
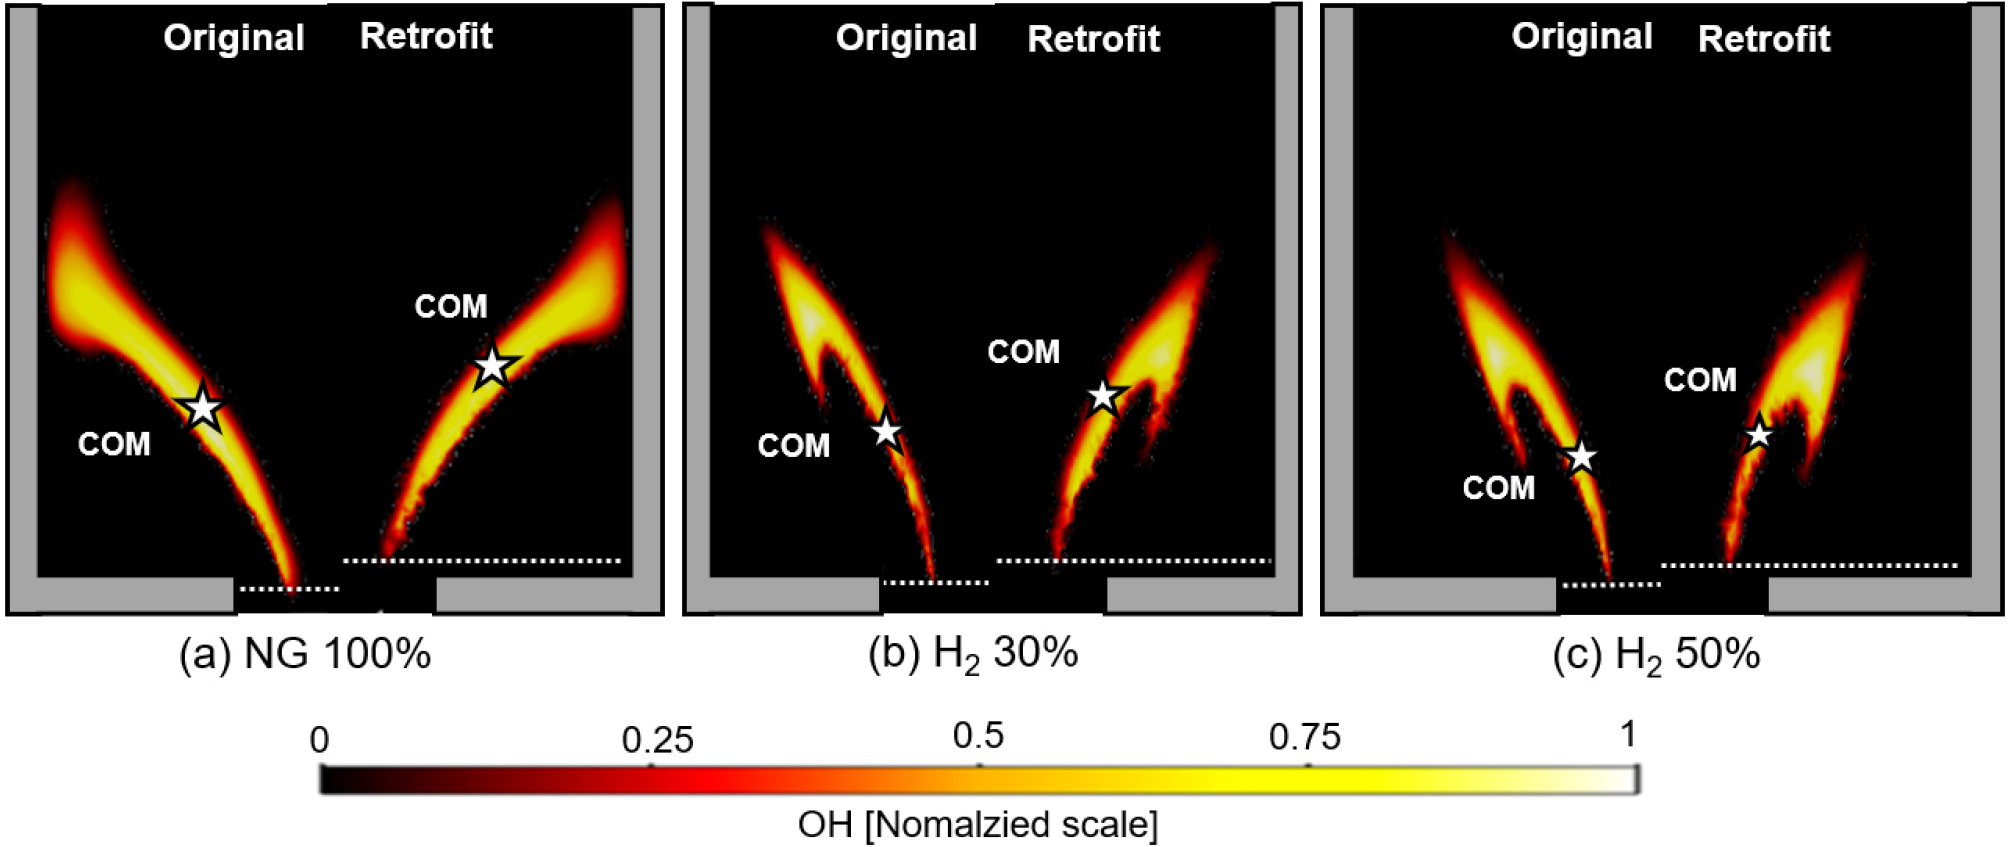
To enable a visual comparison of the distribution characteristics, the regions of high OH concentration for each condition were highlighted and presented in Fig. 9. The analysis shows that, for both the original and retrofit nozzles, the OH front progressively shifted toward the nozzle tip with increasing hydrogen co-firing ratio, consistent with the forward movement of the flame tip observed in the temperature field analysis presented earlier. When comparing nozzle geometries, the OH front in the retrofit nozzle was positioned relatively farther from the dump plane compared with the original nozzle under the same co-firing conditions, and its distribution tended to be more concentrated. This behavior can be attributed to the cooling airflow introduced through the retrofit nozzle, which elevates the flame position to some extent, thereby delaying the temperature rise in the initial axial region and locally restricting the high-temperature conditions required for OH radical formation.
Based on the OH concentration results for different hydrogen co-firing ratios and nozzle geometries, the time delay (𝜏) was determined following the derivation procedure described in Section 2.1.3. Using this approach, the flame transfer function parameters for the various co-firing ratios and nozzle geometries were calculated, and the results are summarized in Table 3.
Table 3.
Flame transfer function parameters.
| H2 ratio | Parameter | Original | Retrofit |
| 0% | 𝜏 [ms] | 10.5 | 11.8 |
| 30% | 𝜏 [ms] | 8.8 | 10.2 |
| 50% | 𝜏 [ms] | 7.0 | 8.2 |
3.2 1D network model analysis results
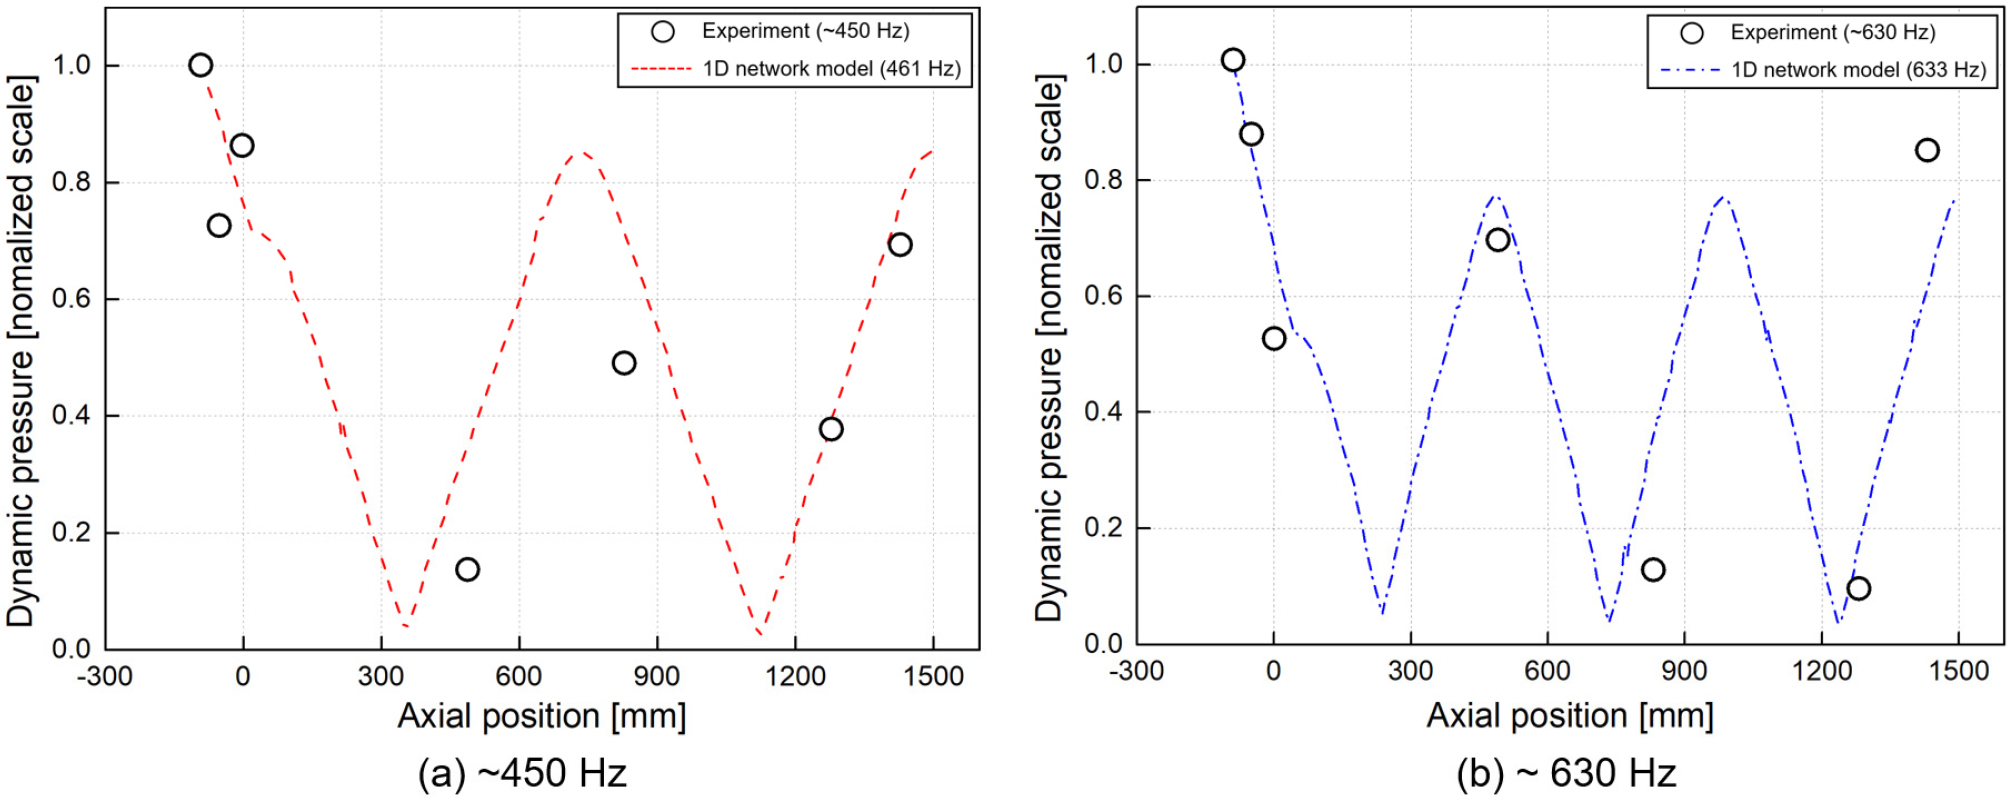
Before conducting the combustion instability analysis using the previously implemented one-dimensional network model, a thermoacoustic analysis was first performed to validate the model. Fig. 10 compares the experimentally measured frequencies and dynamic pressure distributions with the predictions of the one-dimensional network model. Fig. 10(a) and 10(b) correspond to the 400 Hz and 600 Hz frequency bands, respectively. In both cases, the frequencies and mode distributions predicted by the model showed trends consistent with the experimental observations, demonstrating overall good agreement.
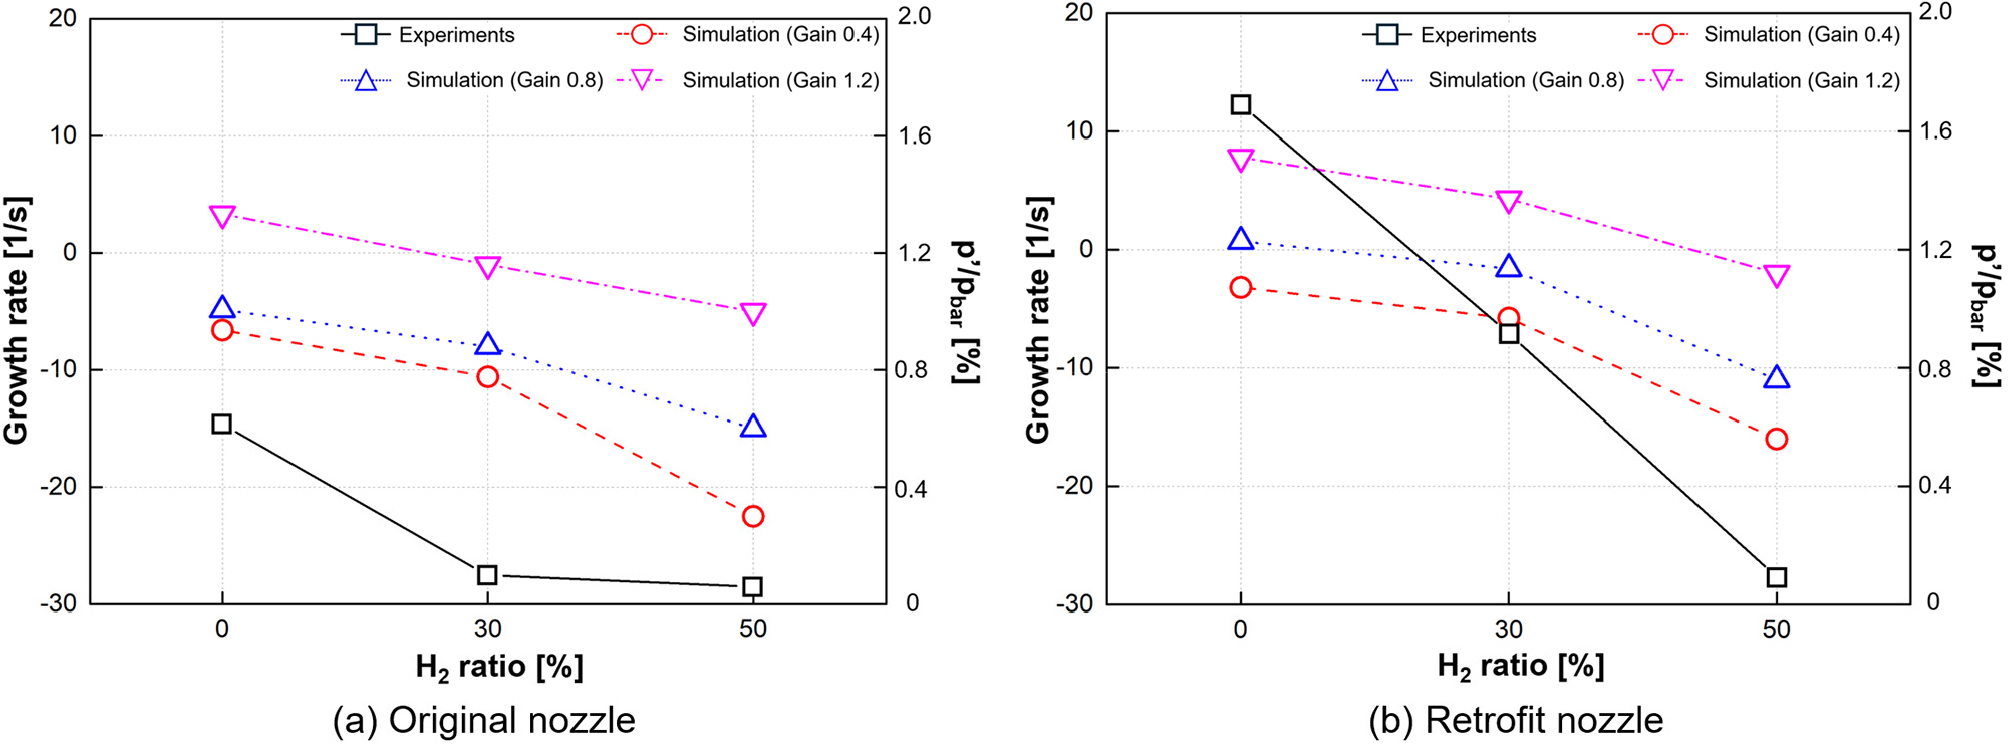
Subsequently, combustion instability analyses were performed for the 400 Hz and 600 Hz frequency bands using the validated model. In the analysis, the 𝜏 values in Table 3 calculated from the OH concentration distributions obtained via CFD for different co-firing ratios and nozzle geometries were applied. The gain value was set to three different levels (0.4, 0.8, and 1.2) for the case study. The effects of the hydrogen co-firing ratio and nozzle geometry were examined, and the resulting growth rates from the analysis were compared with the dynamic pressure data measured in the experiments, as shown in Fig. 11(a) and 11(b) present the results for the original and retrofit nozzles, respectively. The x-axis of each graph represents the hydrogen co-firing ratio, the left y-axis indicates the growth rate, and the right y-axis shows the dynamic pressure amplitude measured in the experiments. In the experimental results, both nozzles exhibited a decreasing trend in dynamic pressure amplitude with increasing hydrogen co-firing ratio. Consistently, the combustion instability analysis based on the one-dimensional network model also showed that, as the gain value decreased and the co-firing ratio increased, the growth rate tended to decrease.
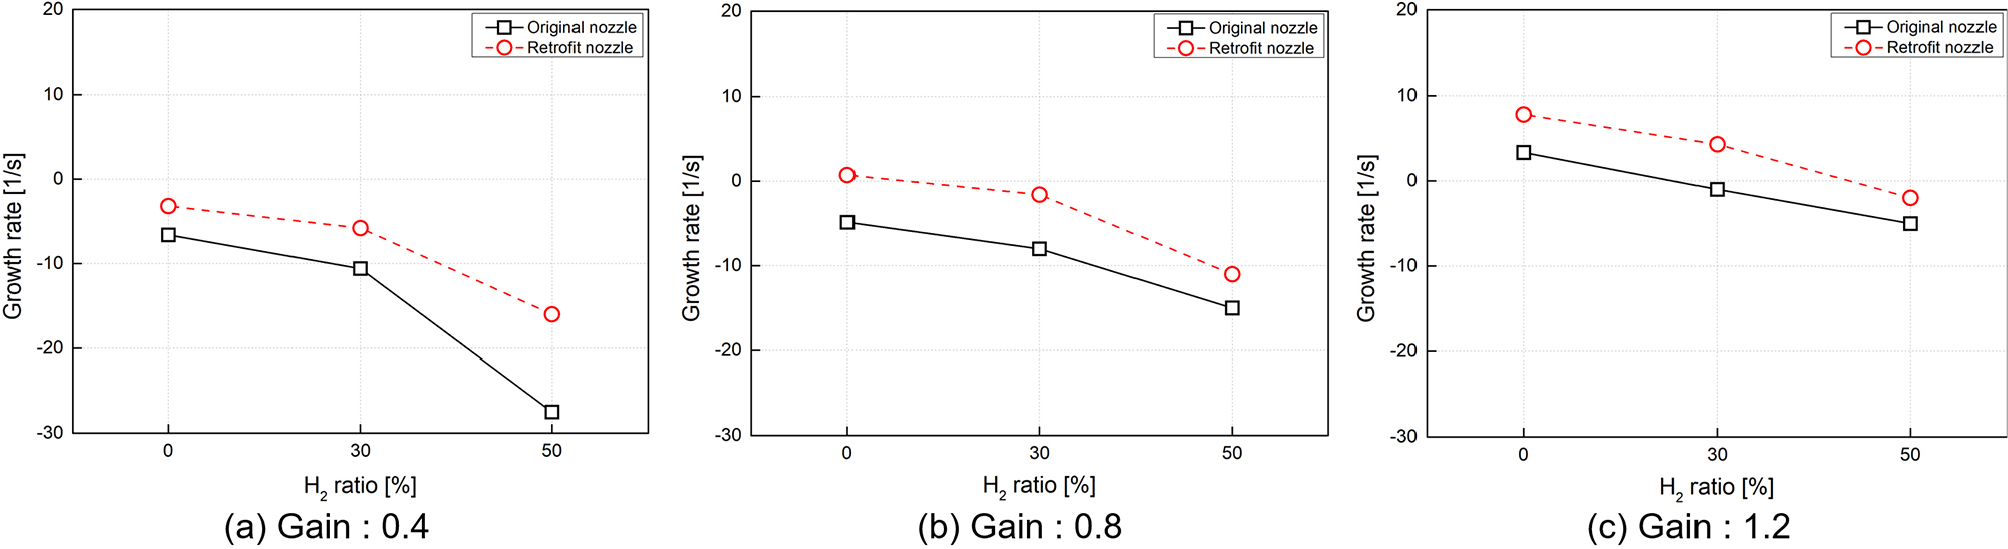
To compare the combustion instability characteristics associated with nozzle geometry, the analysis results for both nozzles were consolidated into single graphs for each gain value, as shown in Fig. 12(a), (b), and (c). The results indicate that, for all gain conditions, the retrofit nozzle exhibited relatively higher growth rates and a more unstable tendency than the original nozzle at the same co-firing ratio. This trend is consistent with the CFD results presented in Section 3.1 and is closely related to the flame lifting caused by the inflow of cooling air through the center of the retrofit nozzle, which increases the distance to the OH center of mass (COM). In this study, the time delay (𝜏) was treated as a key parameter in evaluating the growth rate of combustion instability. Therefore, the results in Fig. 12 can be interpreted as growth rate comparisons based on 𝜏, with the retrofit nozzle structurally characterized by a longer 𝜏 exhibiting higher growth rates.
Furthermore, in the retrofit nozzle, the lifted flame limits OH radical generation, which predominantly occurs in high-temperature regions, resulting in a more confined OH distribution. This change in flame structure leads to an increase in 𝜏, which, under otherwise identical conditions, can exacerbate combustion instability. Consequently, while the cooling-air injection in the retrofit nozzle is highly effective in preventing flashback, it ultimately increases 𝜏 by shifting the flame’s center of mass (COM) downstream, despite a tendency to shorten the overall flame length. Under the given operating and geometric conditions, this may introduce a trade-off relationship between flashback prevention and combustion instability. These findings highlight the need for an optimized nozzle design process that considers cooling airflow, flashback mitigation, and combustion instability, along with other combustion performance characteristics.
4. Conclusion
In this study, the effects of hydrogen co-firing ratio and nozzle geometry on combustion instability characteristics were investigated using a lab-scale combustion test rig. The CFD model was validated by comparing calculated OH concentration distributions with experimentally obtained OH chemiluminescence images, while the one-dimensional network model was validated through comparison of its predicted mode distributions and growth rates with experimental observations.
The analysis revealed that increasing the hydrogen co-firing ratio led to a rise in central temperature, a reduction in flame length, and a contraction of the high concentration OH radical region. In the nozzle geometry comparison, the inflow of cooling air through the center of the retrofit nozzle reduced the central temperature, lifted the flame position, and further narrowed the OH radical distribution. Such variations in co-firing ratio and nozzle geometry affected the flame structure, thereby altering the time delay (𝜏), a key parameter of the flame transfer function (FTF).
The network model analysis showed that increasing the co-firing ratio resulted in lower growth rates and higher frequencies, indicating a stabilization trend. Under the same conditions, however, the retrofit nozzle exhibited higher growth rates than the original nozzle, reflecting a relatively less stable behavior. This was attributed to the structural characteristics of the retrofit nozzle’s cooling-air injection, which lifted the flame and restricted OH radical formation primarily occurring in high-temperature regions, thereby increasing 𝜏.
Overall, while this design can be effective in preventing flashback, it may also cause a trade-off under certain conditions by increasing flame length and the associated time delay, potentially exacerbating combustion instability. This study quantitatively identified the influence of nozzle geometry and cooling structure on combustion stability and suggests that future nozzle design should incorporate an optimization process considering cooling airflow, flashback prevention, and combustion instability alongside other combustion performance parameters.
